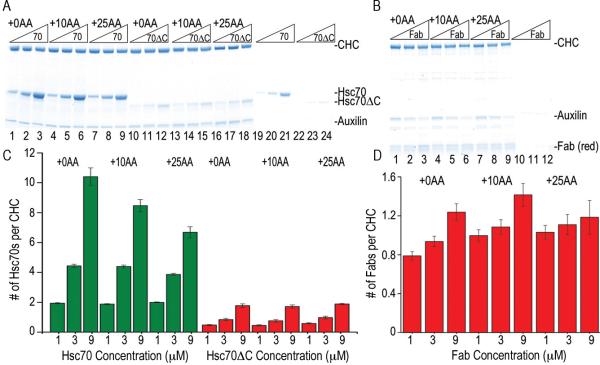
Figure 5. Scattering increases due to Hsc70 binding reflect multiple Hsc70s binding per CHC, not cage expansion.
A. SDS PAGE of pellets of the indicated cages incubated with 1, 3, or 9 μM Hsc70 (lanes 1–9) or Hsc70ΔC (lanes 10–18; [Hsc70] and [Hsc70ΔC] increase from left to right as indicated). Lanes 19–24 show experiments without cages. B: As in A, but using FLAG cages and Fab (lanes 10–12 are no cage control). C: Hsc70/CHC or Hsc70ΔC/CHC ratios plotted vs. [Hsc70] or [Hsc70ΔC], as indicated. D: As in C, but using FLAG cages and Fab.

