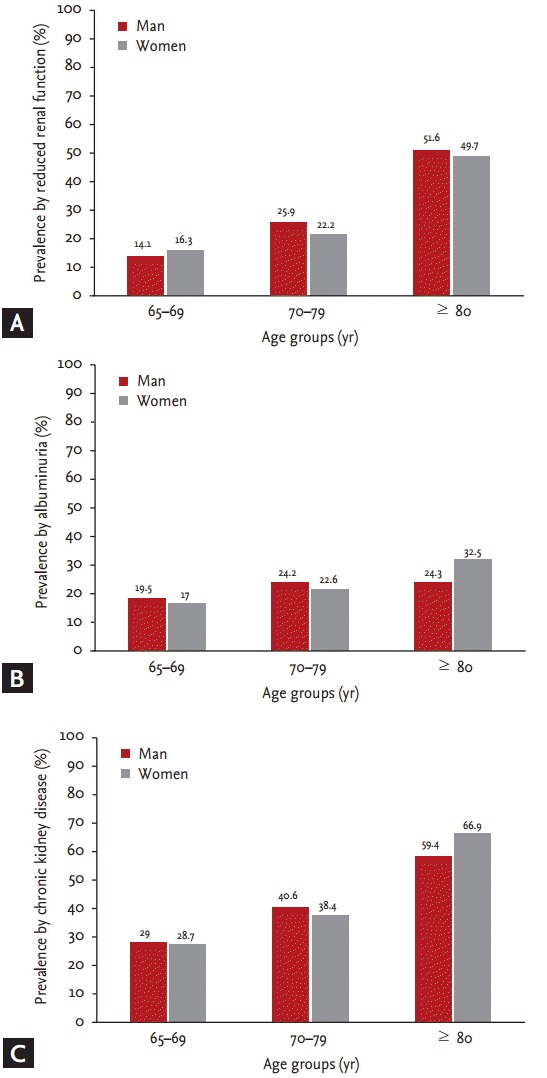
Figure 1.

Prevalence of kidney damage markers and chronic kidney disease according to age groups. (A) Prevalence by reduced renal function. (B) Prevalence by albuminuria. (C) Prevalence by chronic kidney disease.

Prevalence of kidney damage markers and chronic kidney disease according to age groups. (A) Prevalence by reduced renal function. (B) Prevalence by albuminuria. (C) Prevalence by chronic kidney disease.