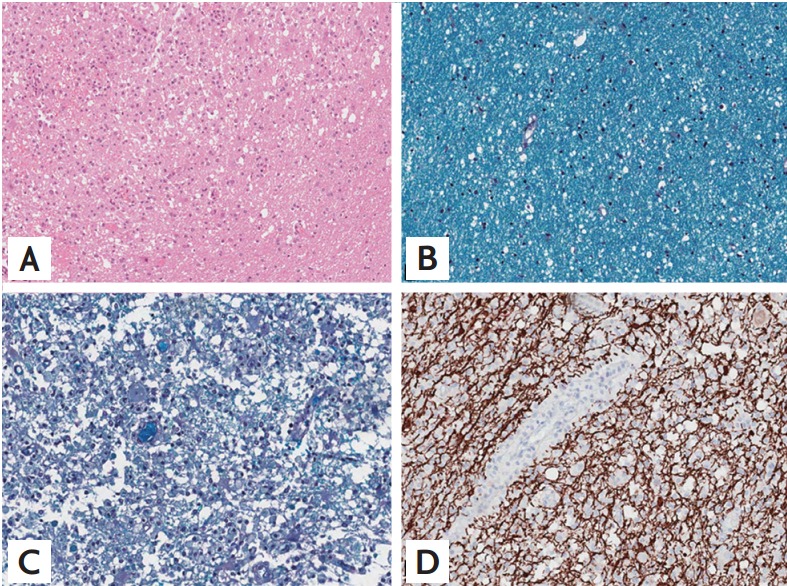
Figure 2.

Histology of the brain biopsy. (A) The lesion shows a large number of gitter cells (foamy macrophages) infiltrating with a relatively sharp border with the normal area (H&E, ×50). (B) Normal area shows intact myelinated nerve fibers on Luxol fast blue (LFB) staining (×200). (C) The lesion shows near-complete loss of myelinated nerve fibers with heavy macrophage infiltration compared to the normal area (LFB stain, ×200). (D) Neurofilament stain (×100) of the lesion shows relatively intact axons.
