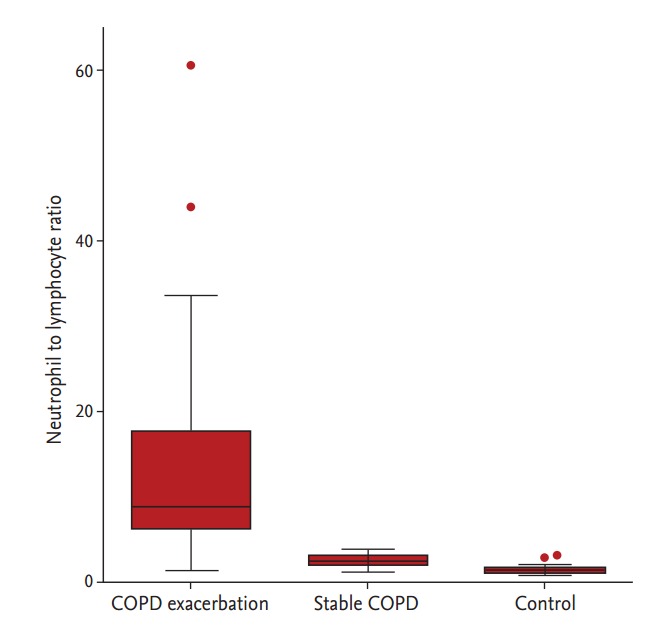
Figure 1.

Neutrophil to lymphocyte ratio in patients with chronic obstructive pulmonary disease (COPD) exacerbation, stable COPD, and controls. Box plots represent median, inter-quartile range, and range with outliers plotted separately.

Neutrophil to lymphocyte ratio in patients with chronic obstructive pulmonary disease (COPD) exacerbation, stable COPD, and controls. Box plots represent median, inter-quartile range, and range with outliers plotted separately.