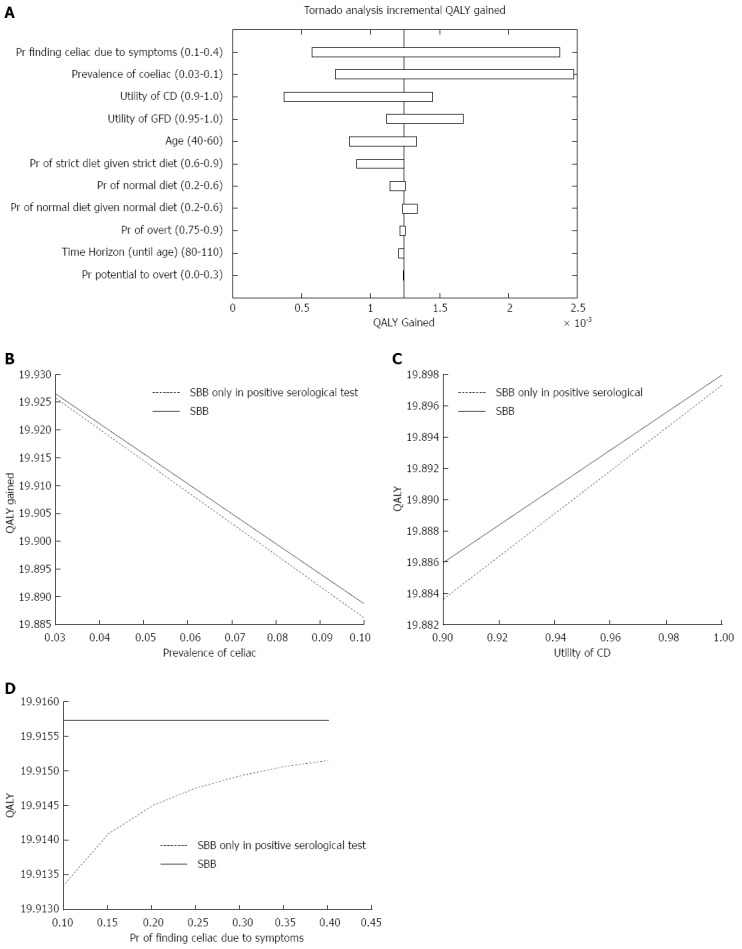
Figure 1.

Quality adjusted life-years outcome. A: Influential parameters on the incremental quality adjusted life-years (QALY); B: One-way sensitivity analysis figure of the prevalence of celiac disease; C: One-way sensitivity analysis figure of the utility of celiac disease; D: One-way sensitivity analysis figure of the probability of diagnosing celiac disease due to symptoms. CD: Celiac disease; GFD: Gluten free diet; SBB: Small bowel biopsy.
