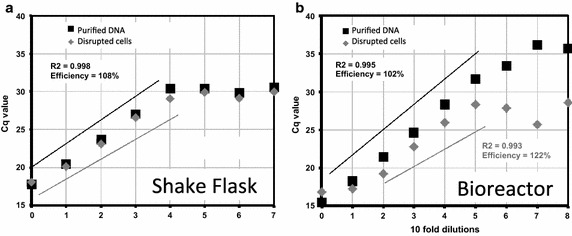
Fig. 4.

Influence of disrupted CHO cells on amplification efficiency for a genomic target. Real time PCR was performed using disrupted cells (grey symbols and lines) or purified DNA (black symbols and lines) from shake flask (a) and bioreactor (b) cultivation as template. Undiluted shake flask cell-sonicate and purified DNA samples were estimated to contain 115 gDNA (5.1 × 10⁴ genome copies) by spectrophotometry and densitomery. Undiluted bioreactor cell-sonicate and purified DNA samples were estimated to contain 1 µg gDNA (3.78 × 10⁵ genome copies) by spectrophotometry and densitomery. Cq values were plotted against tenfold dilutions of template source. Lines indicate data points for which amplification efficiency is 100 ± 10 % efficiency, at a confidence level of R2 > 0.99. Data featured is typical of n = 3 analytical repeats
