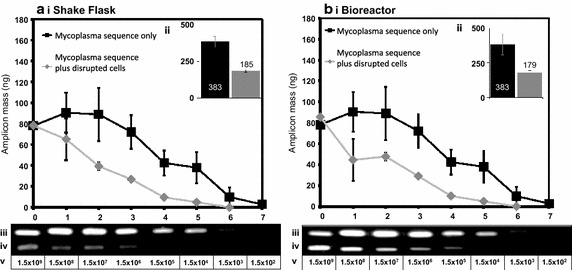
Fig. 8.

Influence of disrupted CHO cells on e-pPCR detection of a mycoplasmal target sequence. 5 ng of plasmid encoding a mycoplasmal DNA sequence (1.54 × 10⁹ copies) was used as e-pPCR template either as purified DNA or purified DNA plus disrupted cells derived from a sample containing a total of 2 × 10⁶ cells from shake flask (a) and 2.5 × 10⁵ cells from bioreactor (b) cultivation. For both cultivation methods the following data are depicted. The mass of amplicon produced in a reaction is plotted as a function of sample dilution (i). Inlaid graphs (ii) plot the area (arbitrary units) under each curve as a bar chart. Agarose gel images show the 184 bp amplicons generated from the purified plasmid DNA (iii) and plasmid DNA plus disrupted CHO cells (iv). The number of copies of the plasmid molecule in a given sample is indicated in the row labelled (v)
