
Figure 1.
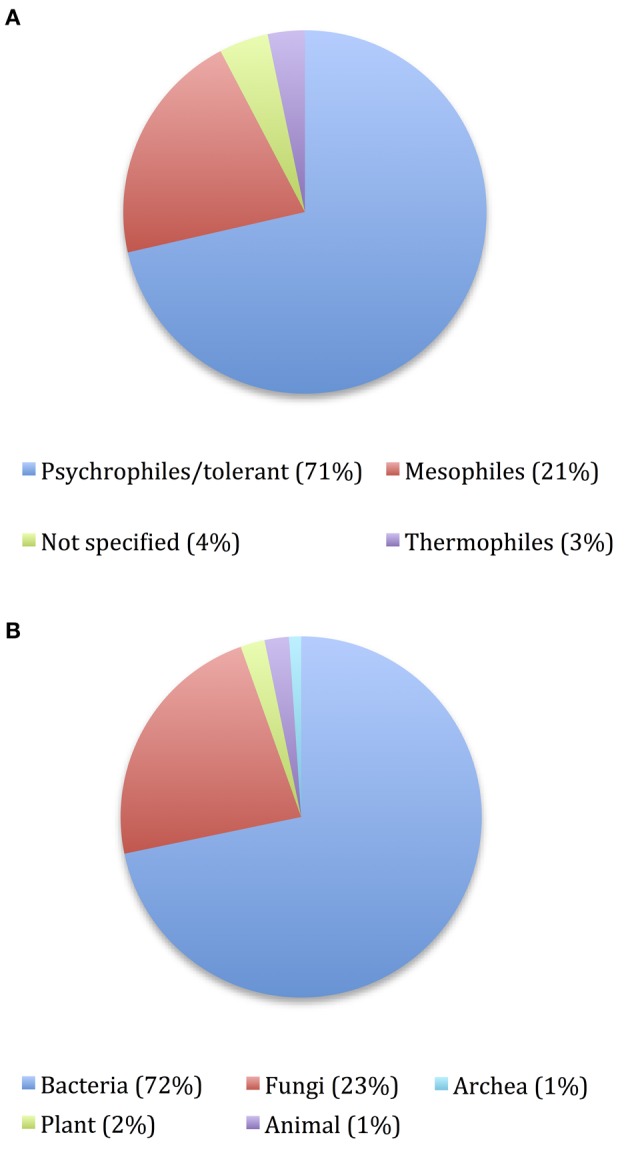
Pie charts showing the distribution of cold-active enzymes reported in Table 1 in two different situations: (A) Nature of organism source and (B) Organism source.
Official websites use .gov
A
.gov website belongs to an official
government organization in the United States.
Secure .gov websites use HTTPS
A lock (
) or https:// means you've safely
connected to the .gov website. Share sensitive
information only on official, secure websites.
Pie charts showing the distribution of cold-active enzymes reported in Table 1 in two different situations: (A) Nature of organism source and (B) Organism source.