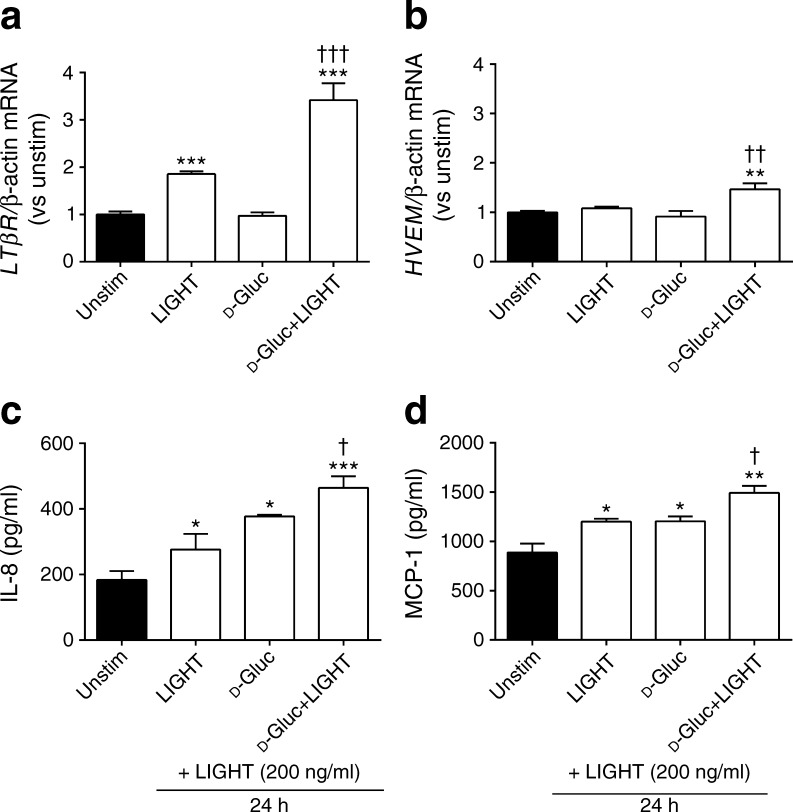
Fig. 5.
LIGHT increases the inflammatory potential of glucose-stimulated HAEC cells. HAECs were stimulated for 3 h (a, b) or 6 h (c, d) with either LIGHT (200 ng/ml), d-glucose (10 mmol/l) or a combination thereof. Gene expression of the LTβR (a) and HVEM (b) were examined by qPCR and data are given in relation to the control gene β-actin. The levels of IL-8 (c) and MCP-1 (d) were assessed in cell supernatant fractions by ELISA. (c, d) The cells were pretreated for 6 h as described above, followed by incubation with LIGHT (200 ng/ml) for 24 h. The medium was changed before the last incubation with LIGHT for 24 h. In all experiments, unstimulated cells received vehicle. Data are presented as mean ± SEM (n = 4–6). * p < 0.05, ** p < 0.01 and *** p < 0.001 vs unstimulated cells (Student’s t test). † p < 0.05, †† p < 0.01 and ††† p < 0.001 vs glucose or LIGHT alone. Gluc, glucose; Unstim, unstimulated

