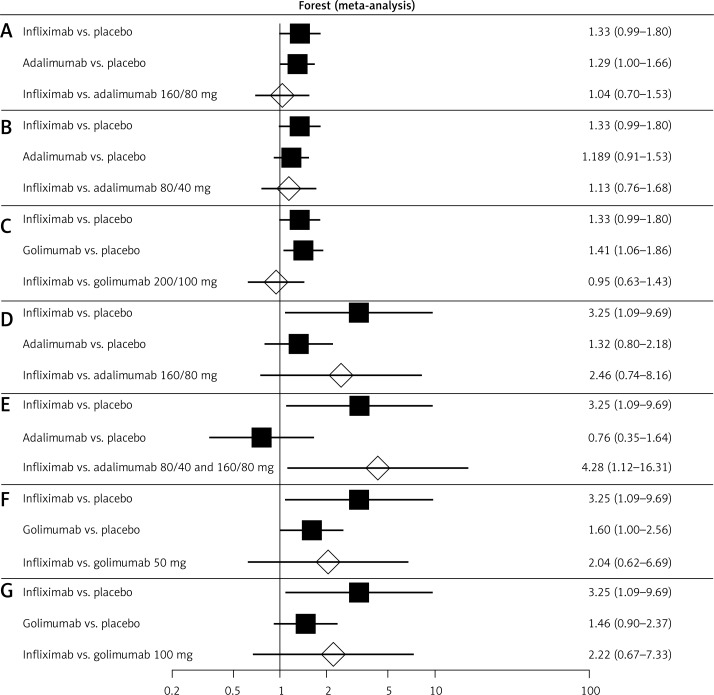
Figure 3.
Forest plot of direct estimates for: A – infliximab (5 mg) vs. placebo and adalimumab (160/80 mg) vs. placebo, and indirect comparison between the treatments in the case of clinical response after 6–8 weeks of drug administration; B – infliximab (5 mg) vs. placebo and adalimumab (80/40 mg) vs.placebo, and indirect comparison between the treatments in the case of clinical response after 6–8 weeks of drug administration; C – infliximab (5 mg) vs. placebo and golimumab (200/100 mg) vs. placebo, and indirect comparison between treatments in the case of clinical response after 6–8 weeks of drug administration; D – infliximab (5 mg) vs. placebo and adalimumab (160/80 mg) vs. placebo, and indirect comparison between treatments in the case of clinical response after 52–54 weeks of drug administration; E – infliximab (5 mg) vs. placebo and adalimumab (80/40) and (160/80) mg vs. placebo, and indirect comparison between treatments in the case of clinical response after 52–54 weeks of drug administration; F – infliximab (5 mg) vs. placebo and golimumab (50 mg) vs. placebo, and indirect comparison between treatments in the case of clinical response after 52–54 weeks of drug administration; G – infliximab (5 mg) vs. placebo and golimumab (100 mg) vs. placebo, and indirect comparison between treatments in the case of clinical response after 52–54 weeks of drug administration

