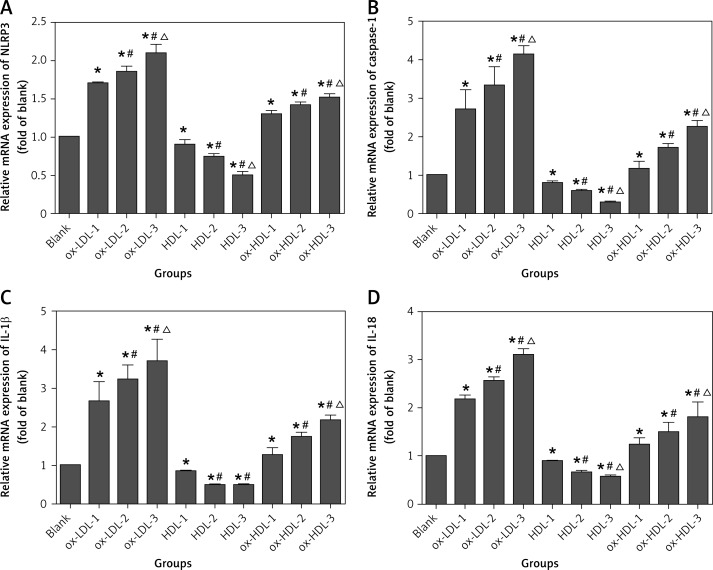
Figure 1.
Ox-LDL, ox-HDL and HDL induced mRNA expression of NLRP3 and its downstream cytokines in human mononuclear cells
Blank – blank control group, HDL-1 – group of HDL at the concentration of 50 mg/l, HDL-2 – group of HDL at the concentration of 100 mg/l, HDL-3 – group of HDL at the concentration of 150 mg/l, ox-LDL1 – group of ox-LDL at the concentration of 50 mg/l, ox-LDL-2 – group of ox-LDL at the concentration of 100 mg/l, ox-LDL-3 – group of ox-LDL at the concentration of 150 mg/l, ox-HDL1 – group of ox-HDL at the concentration of 50 mg/l, ox-HDL-2 – group of ox-HDL at the concentration of 100 mg/l, ox-HDL-3 – group of ox-HDL at the concentration of 150 mg/l. Each set of HDL, ox-LDL, ox-HDL concentration after processing, *p < 0.05, compared with the blank control group was statistically significantly different; #p < 0.05, compared with 50 mg/l group was statistically significantly different, Δp < 0.05, compared with 100 mg/l group was statistically significantly different.

