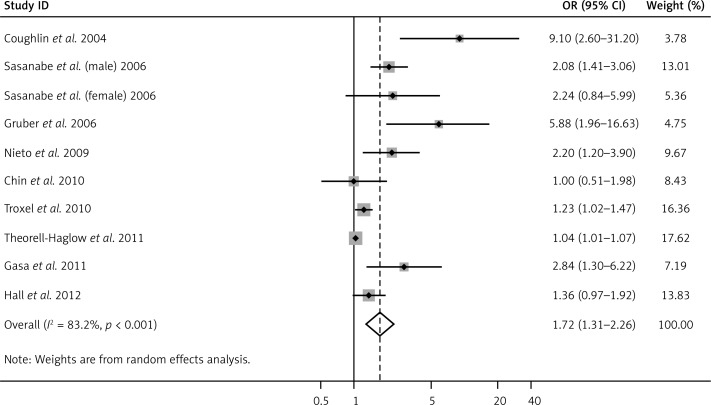
Figure 2.
Forest plot summarizing the association between OSA and MS in the 10 included studies under the random effects meta-analysis. The sizes of the gray boxes in the figure are in proportion to the weight assigned to each study, whereas the point within each box is the OR reported by each study. The horizontal bar is the reported 95% CI for each OR

