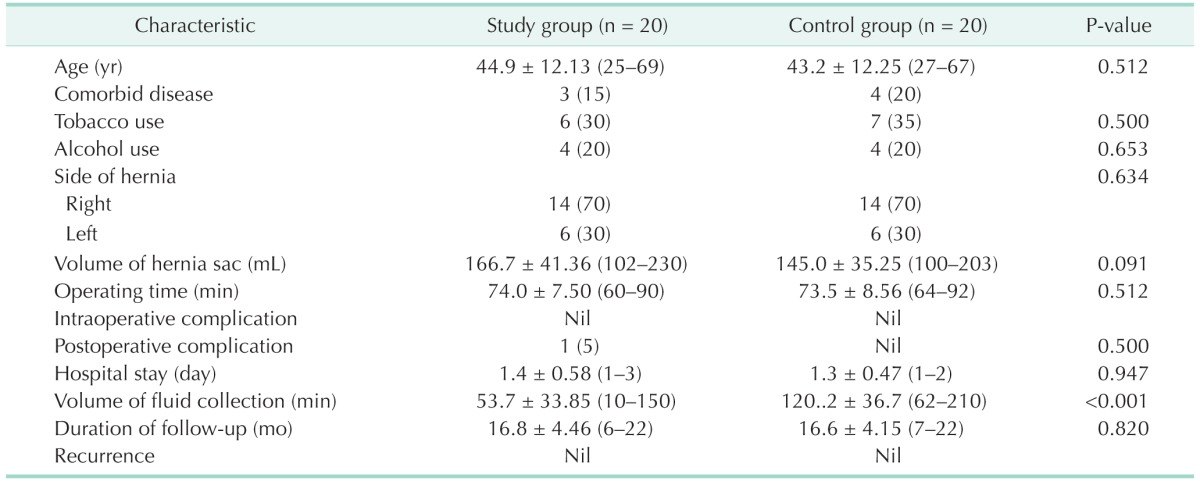
Table 1. The comparison of all demographic, clinical and perioperative findings of the 2 groups.

Values are presented as mean±standard deviation (range) or number (%).
Nil, 0.

Values are presented as mean±standard deviation (range) or number (%).
Nil, 0.