Figure 5.

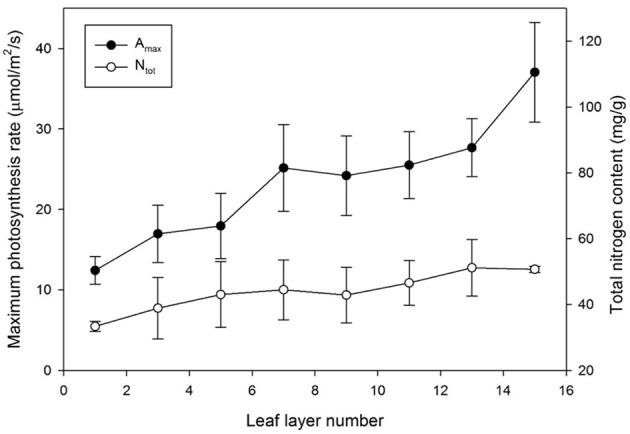
Maximum photosynthesis rate (Amax) and total nitrogen content (Ntot) by leaf layer number. Vertical bars represent the Mean ± SE (n = 5).

Maximum photosynthesis rate (Amax) and total nitrogen content (Ntot) by leaf layer number. Vertical bars represent the Mean ± SE (n = 5).