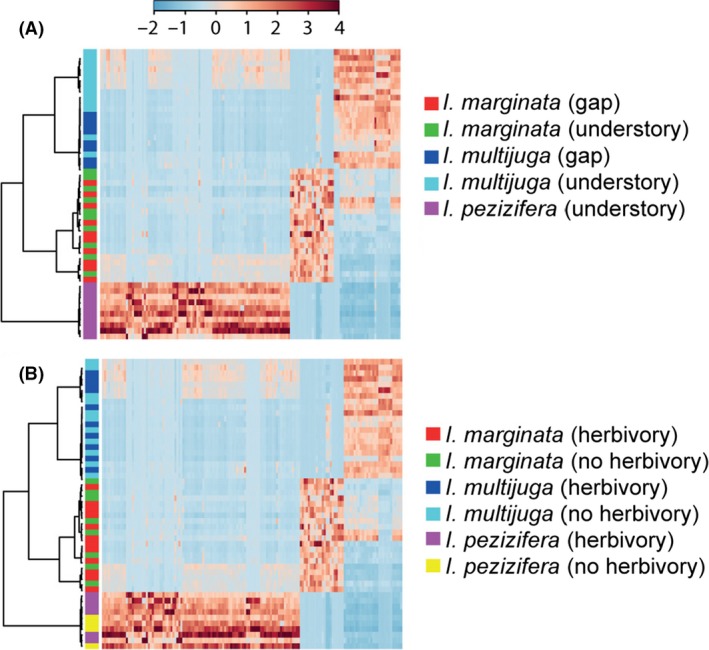
Figure 3.

Heatmap comparison of the influence of light and herbivory on the metabolic profile of different Inga species (each row is a different plant). The top significant (ANOVA) features were selected to build the trees (each column is a feature). Ward linkage and Spearman distance algorithms were used. (A) Comparison of Inga marginata, I. multijuga, and I. pezizifera in gap and understory environments. (B) Comparison of Inga marginata, I. multijuga, and I. pezizifera with and without herbivory. No differences are observable between treatments, but species are clearly distinguished by their metabolite profile.
