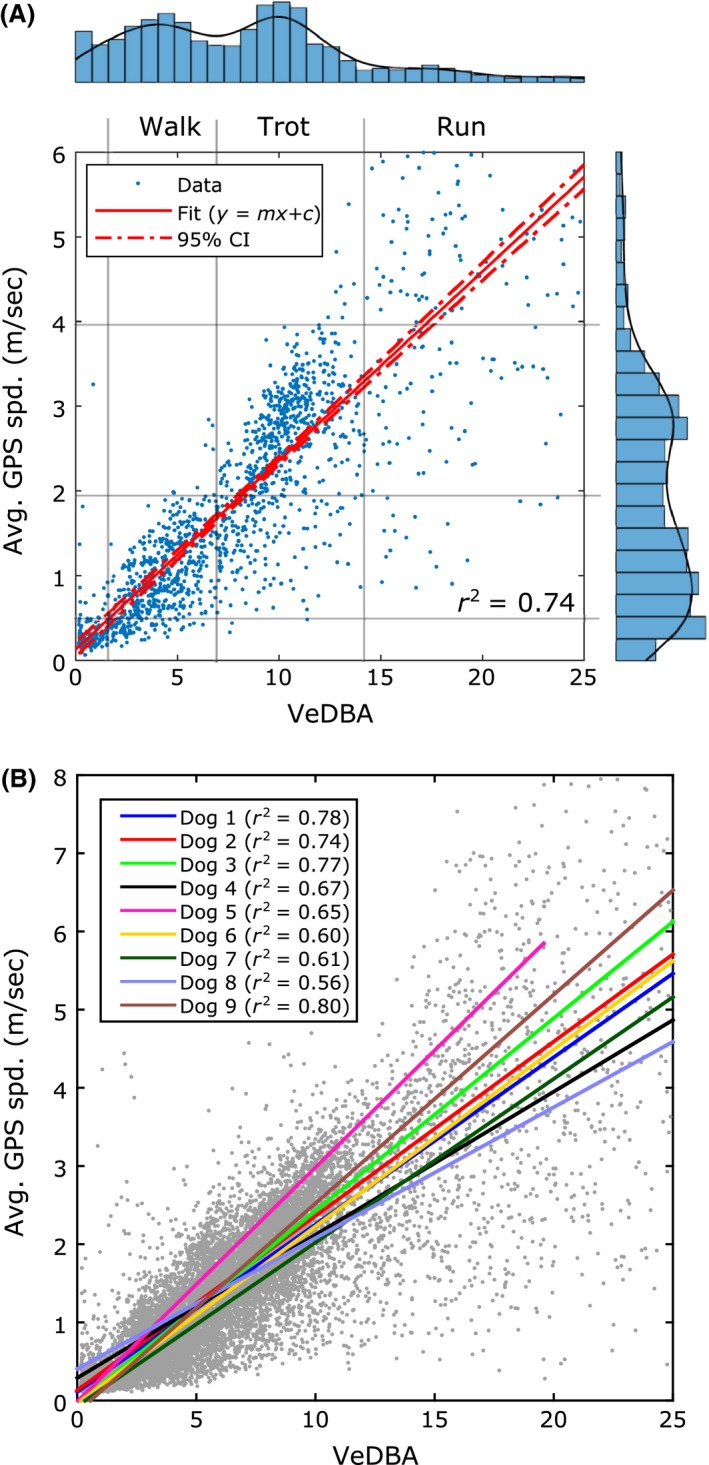
Figure 1.

The relationship between GPS speed (mean over a 2‐s window) and the accelerometer speed proxy (VeDBA) for domestic dogs. (A) An example from dog 2. VeDBA was calculated over a 2‐s window. The linear fit to these data (training data) and 95% confidence intervals (CI) is represented by the solid red and dash dotted lines, respectively (r 2 = 0.74). We use the distribution of the GPS speeds and VeDBA values (histograms with kernel density estimates marked by black lines) to determine areas on the scatter plot which represent walking, trotting, and running gaits. The local minimum of the kernel density estimate is taken as the transition point between walking and trotting. (B) Scatter plot showing the relationship between GPS speed and VeDBA for all dogs and the linear fit for each dog (D1 to D9).
