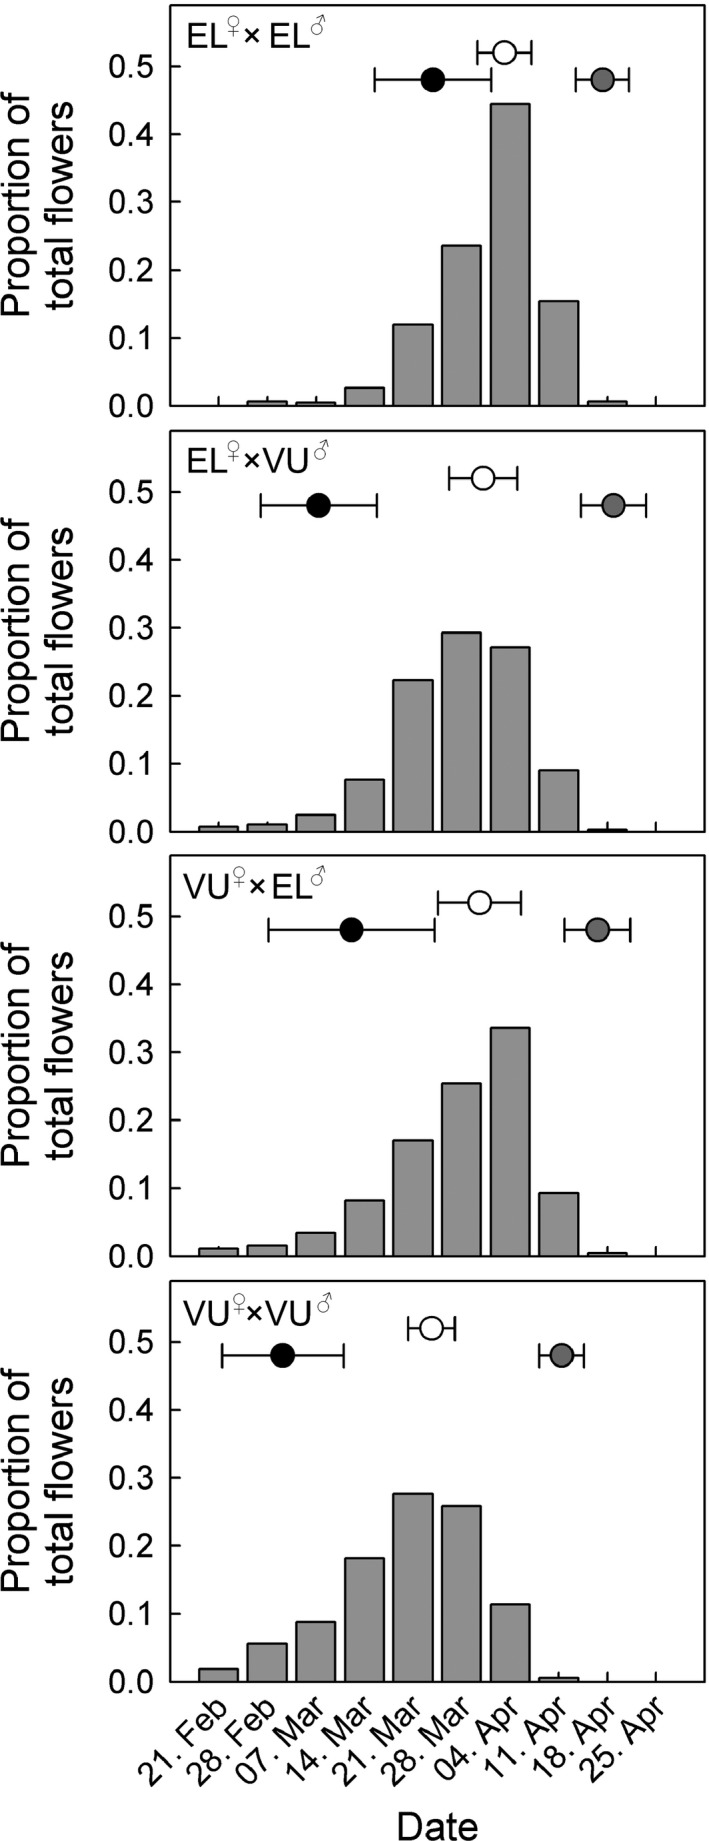
Figure 3.

Parental and F1 phenology: Flowering phenology of Primula elatior (EL♀ × EL♂), Primula vulgaris (VU♀ × VU♂), and their F1 hybrids (EL♀ × VU♂ and VU♀ × EL♂) recorded weekly from plants in a common‐garden experiment, with means (circles) and standard deviations of onset (i.e., date of first flower opening; black symbols), peak (i.e., date of maximal number of open flowers; white symbols), and end (i.e., date of last flower wilting; dark gray symbols) of flowering times. Percentages of total numbers of open flowers per census day (bars) are reported on the y‐axis for a total of 10 census days (x‐axis); 601 flowers in 20 plants of P. elatior, 852 flowers in 22 plants of P. vulgaris, 1287 flowers in 17 plants of EL♀ × VU♂ hybrids and 441 flowers in 15 plants of VU♀ × EL♂ hybrids were surveyed during their entire blooming period. Census data were used to calculate phenological isolation (RIphenoP) and F1 phenology (RIphenoF1; see text).
