
Figure 2.
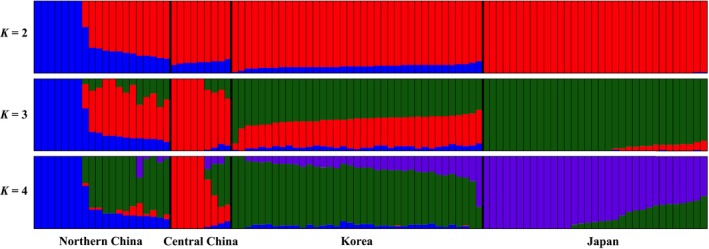
Population structure inferred by the STRUCTURE procedure generated from the 99 wild soybean ecotypes. The colors in each ecotype in A for K = 2, 3, and 4 represent the fraction of their genome that is inferred to be from each of four genetic groups. Red: GROUP 1; Blue: GROUP 2; Green: GROUP 3; Purple: GROUP 4.