FIGURE 2.
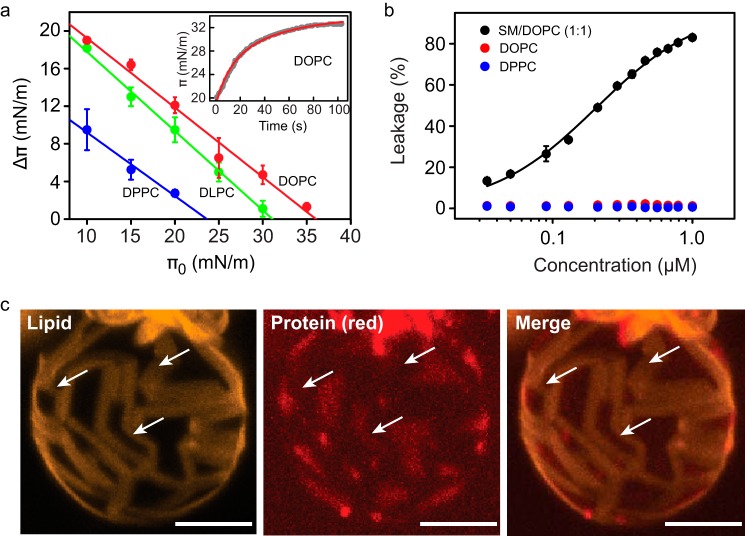
Interaction of FraC with model membranes. a, change in surface pressure of lipid monolayers composed of DOPC (red), DLPC (green), or DPPC (blue) after treatment with FraC (1 μm). The parameter πc corresponds to the value of π0 where the regression line intersects the abscissa. The inset shows a representative example of the kinetic profile of insertion of FraC in DOPC monolayers (π0 = 20 mN/m, gray trace). A hyperbola (red line) was fitted to the experimental data, from which the value of Δπ was determined. b, lack of lytic activity of FraC in LUVs made of DOPC (red) or DPPC (blue). The data obtained with SM/DOPC (1:1) represent a positive control (black). The LUVs made of DLPC are permeable to encapsulated dyes in the absence of protein (spontaneous leakage), and thus the data obtained with them was not considered. For the experiments in a and b, the mean and standard deviation of three independent measurements was plotted. c, binding of FraC to GUVs made of DOPC/DPPC (20:80) supplemented with 0.2% DiIC18. This probe partitions in the ordered phase regions (yellow domains) (52, 53). Protein (red) was added to a final concentration of 1.3 μm. Lipid and protein were visualized with a 593/40-nm bandpass filter (yellow, left panel) or with a 650-nm long pass filter (center panel), respectively. Merged images are shown on the right panel. The white arrows point at liquid disordered regions (dark domains) where FraC is preferentially located. The white scale bar, 5 μm.

