FIGURE 3.
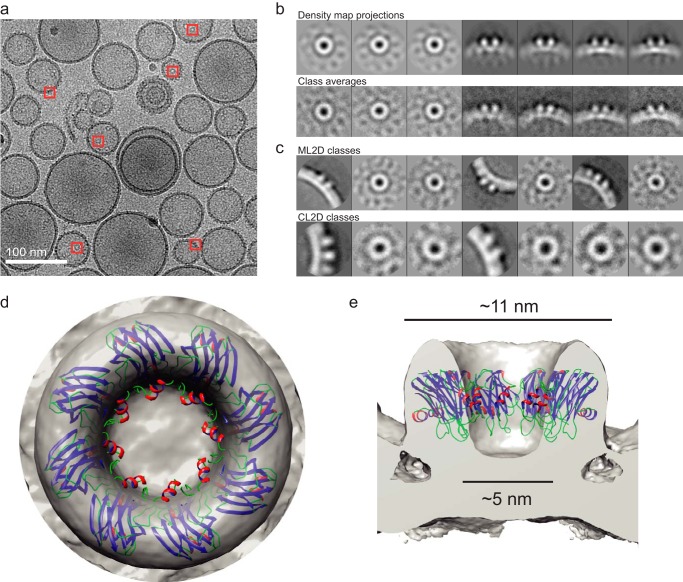
Structure of the oligomeric prepore of FraC bound to DOPC vesicles. a, representative image of FraC in DOPC vesicles obtained by cryo-EM. Top and side views of the protein oligomers were selected (red squares) for subsequent classification analysis. The scale bar corresponds to 100 nm. b, density map projections (top row) and two-dimensional class-averaged particles (bottom row) employed to build a three-dimensional model of the protein oligomer (see below). c, set of particles obtained by maximum-likelihood (ML2D, top row) and hierarchical clustering (CL2D, bottom row) procedures. d, top view, and e, side view of the three-dimensional model of the prepore of FraC bound to vesicles of DOPC. The atomic model of FraC was built as an octamer using the coordinates of the protomer of FraC prior to pore formation (entry code 4TSL).

