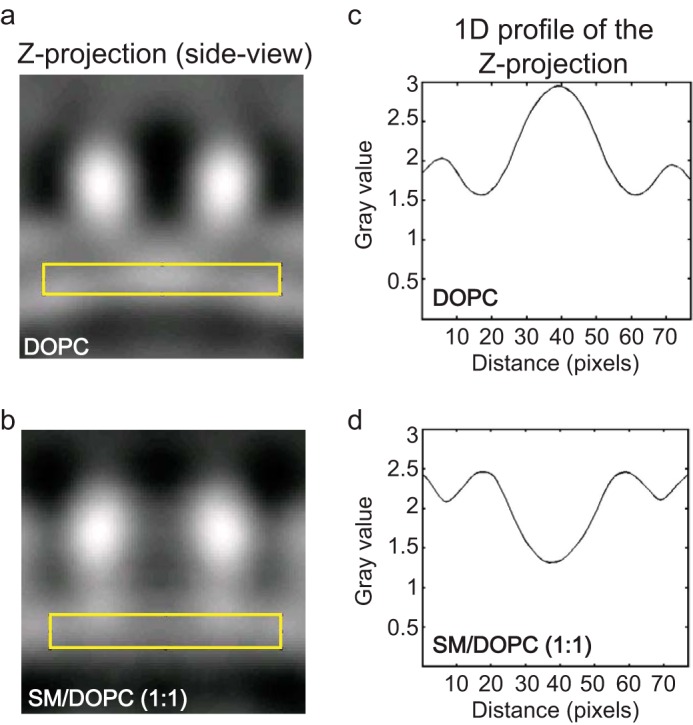
FIGURE 4.

Electron density of FraC bound to vesicles. Side view (Z-projection) of oligomers of FraC bound to vesicles of DOPC (a) or SM/DOPC (1:1) (b). The yellow rectangle indicates the region where the one-dimensional profile of the Z-projection (shown in c and d) was calculated. The intensity of the electron density is expressed in gray values. b and d correspond to the analysis carried out with published data (20), although we note that the analysis presented here has not been shown elsewhere.
