
FIGURE 2.
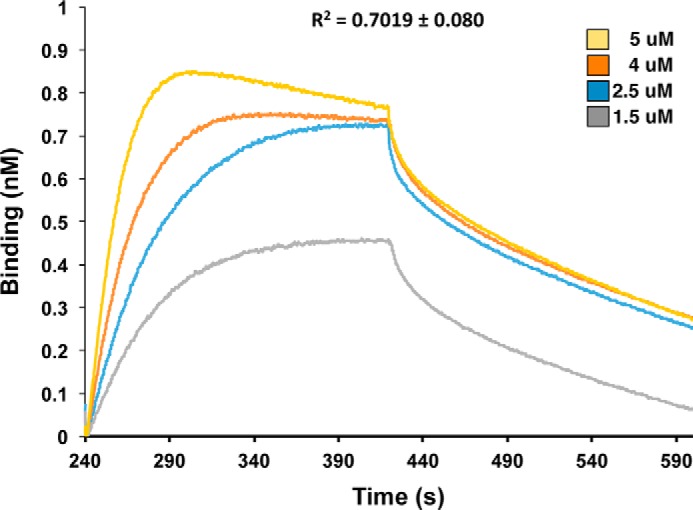
Biolayer interferometry of the CdiA-CT/CdiIE479 binding interaction. Immobilized CdiIE479-His6 was exposed to varying concentrations (1.5–5 μm) of CdiA-CTE479, and the binding interaction and dissociation monitored a wavelength shift (nm). Representative association and dissociation curves are presented with the overall correlation coefficient (R2) shown for the fit.