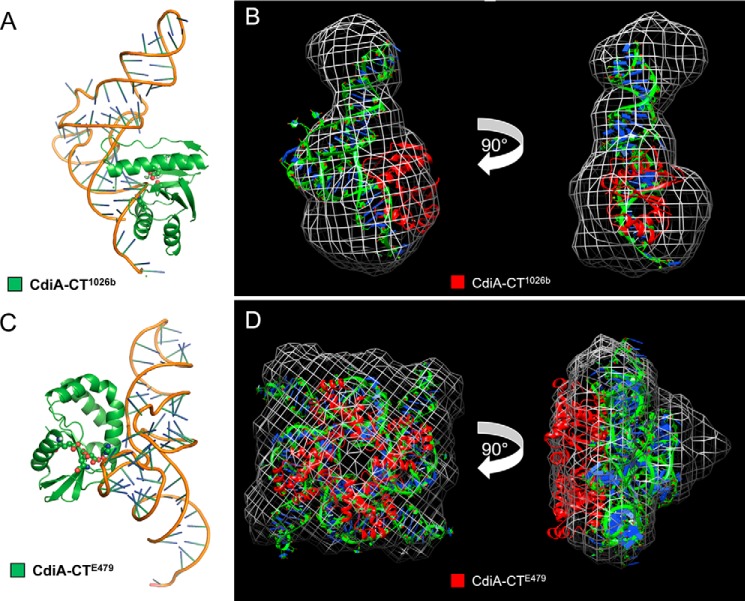
FIGURE 7.
Computational modeling and SAXS analysis of tRNA/CdiA-CT complexes. A, CdiA-CT1026b (green schematic) binding with its active-site residues adjacent to the backbone of the tRNACys (PDB code 1B23) amino acceptor stem loop with active-site residues shown as spheres (oxygen and nitrogen atoms colored red and blue, respectively). B, SAXS electron density envelope (white mesh) fitted with the docking solution showing the monomeric CdiA-CT1026b toxin (red schematic) bound to tRNACys (green and blue). C, CdiA-CTE479 (green schematic) binding with its active-site residues adjacent to the backbone of the tRNACys T-loop with active-site residues shown as spheres (oxygen and nitrogen atoms colored red and blue, respectively). D, SAXS electron density envelope (white mesh) fitted with the docking solution showing the tetrameric CdiA-CTE479 toxin bound to four molecules of tRNACys (green and blue).

