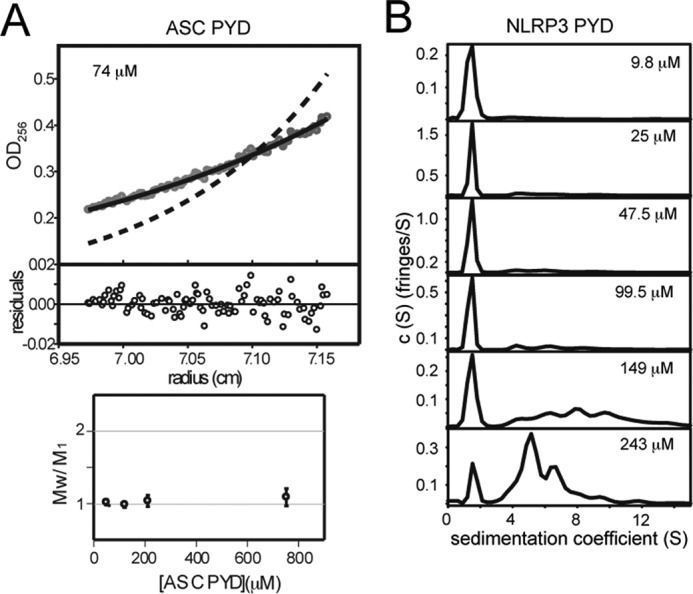
FIGURE 3.

AUC proves oligomerization of PYDs. A, sedimentation equilibrium analysis of ASC PYD at 74 μm in 20 mm glycine, 1 mm TCEP (pH 3.7). Experimental data fit well to a model of the protein being monomeric (solid line) but not to a dimer model (dashed line). The residuals of the fitting of the experimental data to the monomeric model are shown. Plot at the bottom shows the variation of the association state (Mw/M1) with protein concentration (50–745 μm). B, sedimentation velocity plots for NLRP3 at different protein concentrations in 1 mm TCEP (pH 3.6). The percentage of monomeric species in the samples (peak at ∼1.5 S) decreases as follows (from top to bottom): 84.4, 77.3, 75.1, 69.3, 29.1, and 9.8%. Samples were polydisperse, and the aggregation number of the oligomerized species could not be determined.
