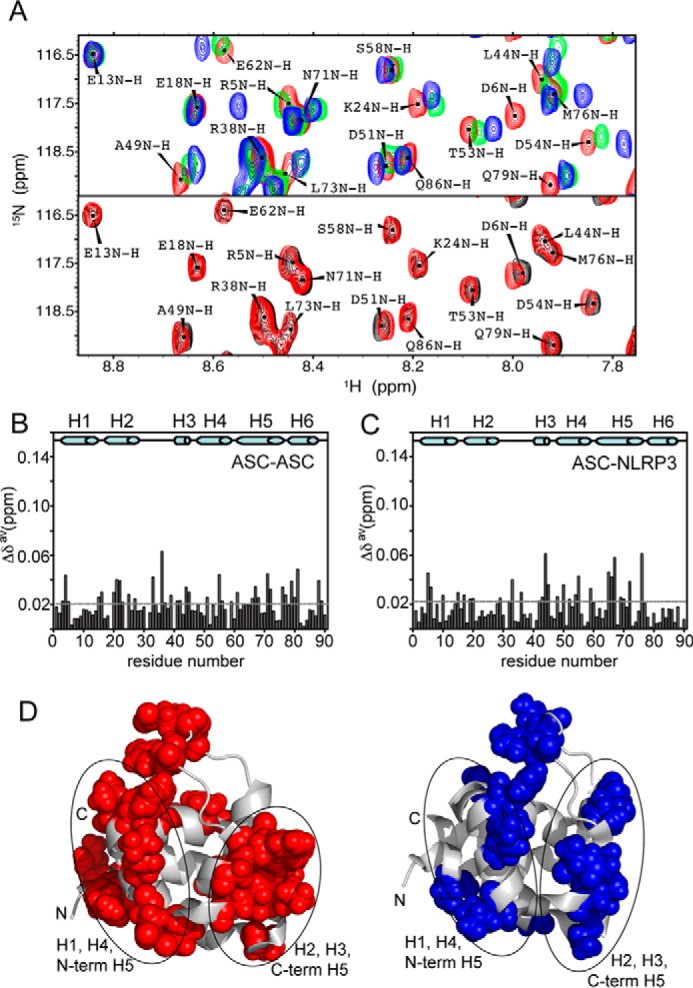
FIGURE 8.

ASC PYD mode of interaction in different conditions. A, top, regions of SOFAST-HMQC spectra of ASC at different concentrations showing typical shifts upon ASC·ASC binding in the absence and presence of NaCl. Top, blue, 50 μm 15N ASC; green, 50 μm 15N ASC + 500 μm ASC; red, 50 μm 15N ASC, 100 mm NaCl. Bottom, red, 50 μm 15N ASC, 100 mm NaCl (same as in top); black, 50 μm 15N ASC + 250 μm ASC, 100 mm NaCl. B and C, chemical shift differences versus residue number of ASC PYD upon binding for the ASC·ASC and ASC·NLRP3 interaction at pH 5.8 (both at a ratio of 1:5 protein/protein concentration). D, residues with the largest chemical shift differences upon binding are mapped in the three-dimensional structure (red and blue for the ASC·ASC and ASC·NLRP3 interaction, respectively).
