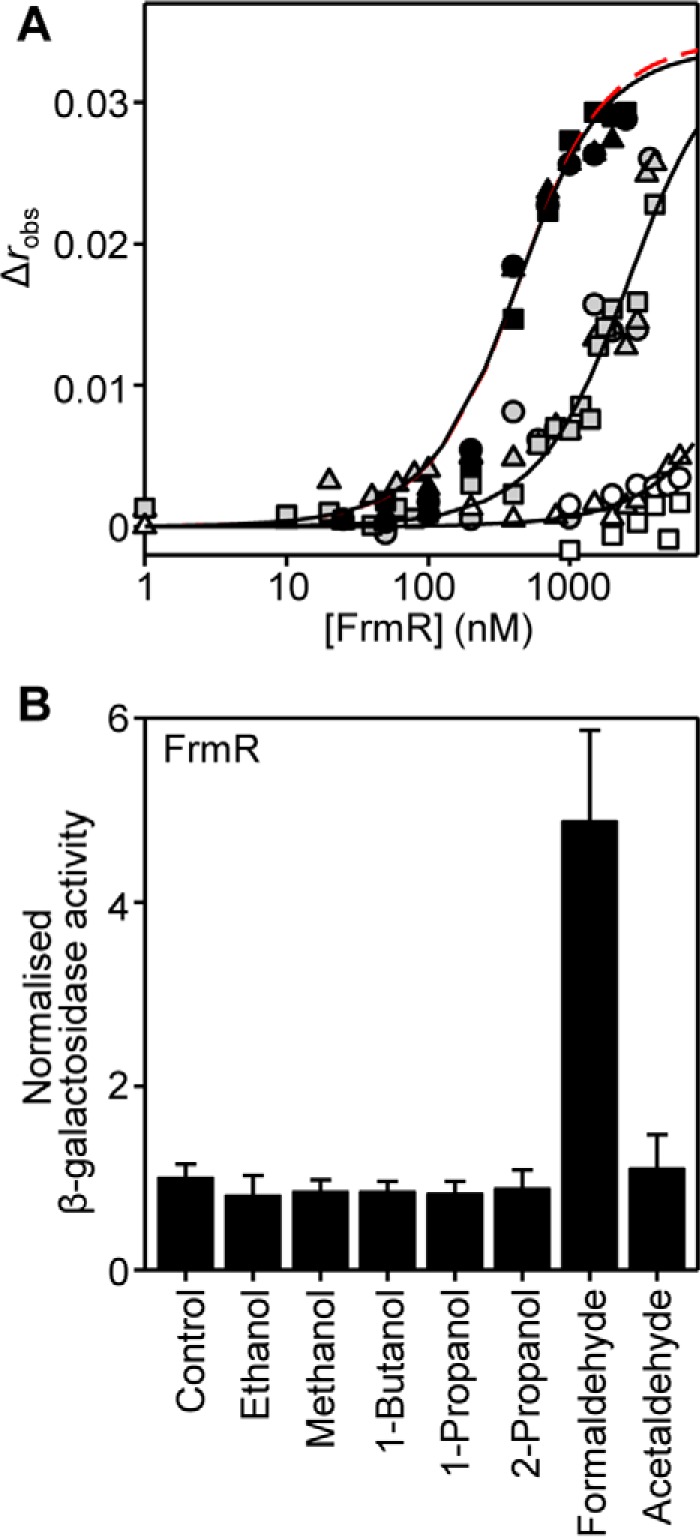
FIGURE 3.

FrmR responds specifically to formaldehyde in vitro and in vivo. A, anisotropy change upon titration of a limiting concentration of frmRAPro (10 nm) with FrmR in the presence of 5 mm EDTA and either 20 μm acetaldehyde (black symbols), 10 μm formaldehyde (gray symbols), or 20 μm formaldehyde (open symbols). Symbol shapes represent individual experiments. Data were fit to a model describing a 2:1 protein tetramer (nondissociable)/DNA stoichiometry (binding with equal affinity) (50, 86), and lines represent simulated curves produced from the average (apparent) KDNA determined across the experimental replicates shown. The dashed red line (largely obscured) is a simulated curve based on the published KDNA of apo-FrmR (50), presented here for comparative purposes. B, β-galactosidase activity in SL1344 containing PfrmRA-frmR fused to lacZ grown to mid-exponential phase in M9 minimal medium in the absence (control) or presence of MNIC indicated alcohol or aldehyde (see “Experimental Procedures” for concentrations). Values are means of three biological replicates (each performed in triplicate) with S.D. (error bars).
