FIGURE 4.
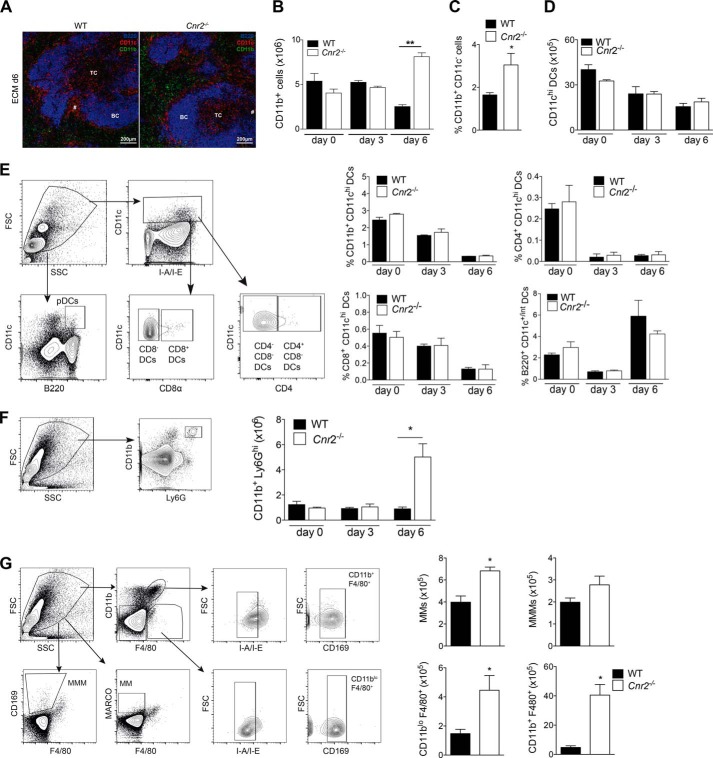
Macrophages and neutrophils accumulate in the spleens of infected Cnr2−/− mice at day 6 when compared with WT controls. A, representative spleen sections of day 6 infected WT (left) and Cnr2−/− (right) mice using immunofluorescence for B220 (blue), CD11c (red), and CD11b (green). TC, T cell zone; BC, B cell zone. B, enhanced numbers of CD11b+ cells in the spleens of day 6 infected Cnr2−/− mice as determined by flow cytometry (mean ± S.E. (error bars), n = 8–10 mice/group). **, p < 0.01. C, percentages of CD11b+ CD11c− cells in the spleens of WT and Cnr2−/− mice at day 6 after PbA infection as determined by flow cytometry (mean ± S.E., n = 4 mice/group; *, p < 0.05). D, numbers of CD11chi DCs in the spleens of WT and Cnr2−/− mice after infection as determined by flow cytometry (mean ± S.D. (error bars), n = 3–4 mice/group). E, DC subsets in the spleens of WT and Cnr2−/− mice after PbA infection. Representative dot plots show gating strategies of splenic DC subsets. The diagrams show the percentages of DC subsets from the spleens of indicated mice at days 0, 3, and 6 after PbA infection (mean ± S.D., n = 3–4 mice/group). F, representative dot plot shows gating strategies for neutrophils in the spleen. The diagram shows numbers of CD11b+ Ly6Ghi cells in the spleen at days 0, 3, and 6 of WT and Cnr2−/− 6 days after PbA infection as determined by flow cytometry (n = 3–4 mice/group; mean ± S.E.; *, p < 0.05). G, representative dot plots showing gating strategies for macrophage subsets in the spleen. The diagram shows the numbers of macrophage subsets in the spleens of WT and Cnr2−/− at day 6 after PbA infection (n = 4 mice/group; mean ± S.E.; *, p < 0.05).

