FIGURE 7.
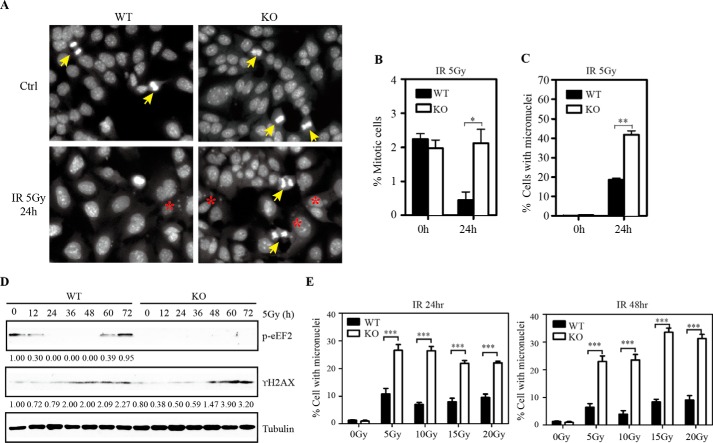
Knock-out of eEF2K renders cells more susceptible to mitotic catastrophe after ionizing radiation. A, representative images of nuclear DAPI staining in WT and KO BMK cells after 5-Gy γ-irradiation. Mitotic cells are marked with a yellow arrow, and cells with micronuclei are labeled with a red asterisk. B, comparison of the percentage of mitotic cells at 0 and 24 h after γ-irradiation. Quantification was done in at least six different fields for each treatment, each field with at least 100 cells. The overall percentage was calculated based on more than 600 cells. The p value was obtained by the Mann-Whitney test. Results are presented as mean ± S.E. (error bars). C, comparison of the percentage of cells with micronuclei at 0 and 24 h after γ-irradiation. Quantification was done in at least six different fields for each treatment, each field with at least 100 cells. The overall percentage was calculated based on more than 600 cells. The p value was obtained by the Mann-Whitney test. Results are presented as mean ± S.E. D, Western blotting analysis of p-eEF2 and γ-H2AX protein in WT and KO BMK cells at various time points after exposure to 5-Gy γ-irradiation. Tubulin was used as a loading control. Quantification was done by using Quantity One software. E, comparison of the percentage of cells with micronuclei at 24 and 48 h after 5-, 10-, 15-, and 20-Gy γ-irradiation. Quantification was done in at least four different fields for each treatment, each field with at least 100 cells. The overall percentage was calculated based on more than 400 cells. The p value was obtained by the Mann-Whitney test. Results are presented as mean ± S.E. *, p < 0.05; **, p < 0.01; ***, p < 0.001.

