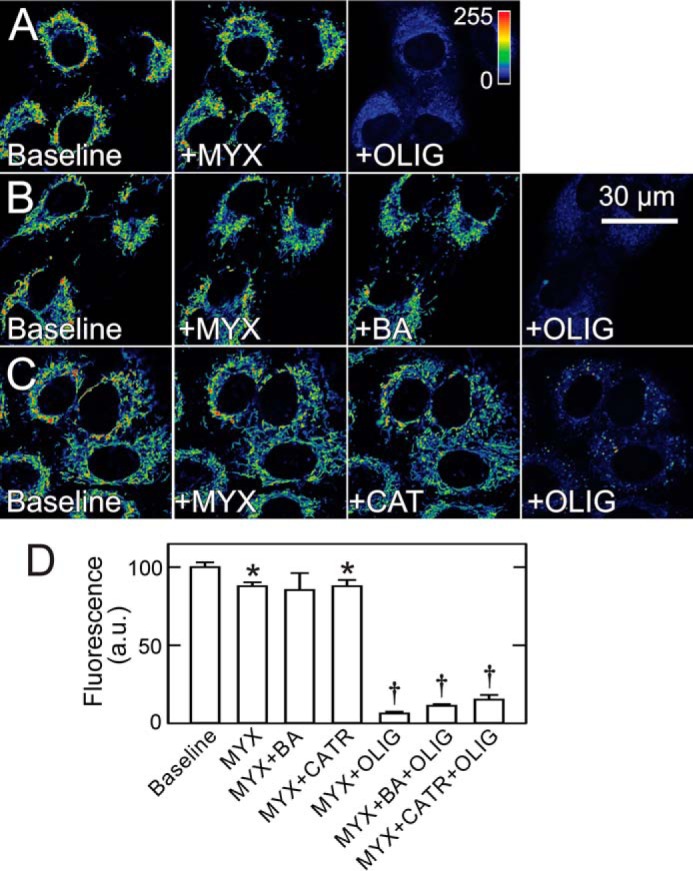
FIGURE 5.

Bongkrekic acid and carboxyatractyloside do not decrease mitochondrial membrane potential in cancer cells after respiratory inhibition. A–C, A549 cells in MHBSS were loaded with TMRM, as described under “Experimental Procedures.” After collection of baseline images, MYX was added, and another image was collected after 30 min. In A, OLIG was added for 30 min. In B and C, BA or CAT was added for 30 min followed by OLIG for another 30 min. D shows changes of fluorescence after different treatments. *, p < 0.05 versus baseline; †, p < 0.05 versus MYX + BA, CAT, or OLIG. a.u., arbitrary units.
