Figure 4.
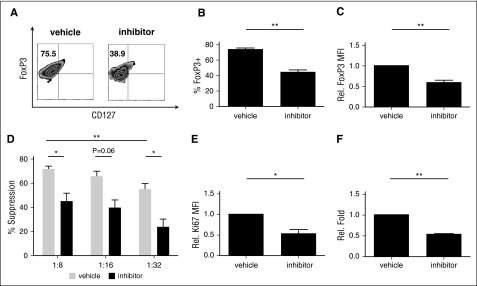
Inhibition of TRAF6 signaling impairs human tTreg expansion, Foxp3 expression and suppressive function. tTregs were treated with TRAF6 inhibitor for 2 days (n = 5). (A) Representative flow figures of FoxP3+ tTregs in different groups. Foxp3 expression was significantly decreased after inhibitor treatment. (B) FoxP3+ population and (C) FoxP3 expression was measured in these groups, and the inhibitor-treated group was significantly decreased. (D) CFSE assay was performed to measure suppressive ability and showed decreased suppressive function at 1:8 and 1:32. Values indicate mean ± SEM of these experiments. (E) Ki67 expression was measured in these groups, and Ki67 expression was decreased in the inhibitor-treated group. (F) Relative fold expansion after inhibitor treatment. *P < .05; **P < .01. MFI, mean fluorescence intensity.

