
Figure 5.
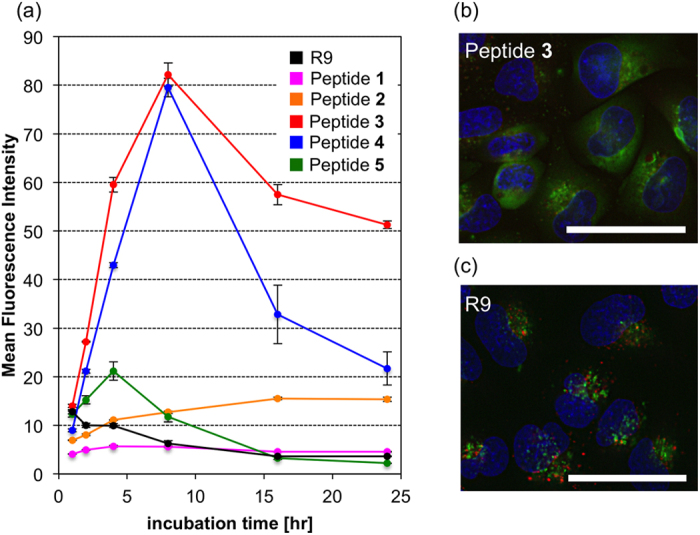
(a) Cellular uptake of the peptides 1–5 and R9 after 1–24 hr (peptide concentration: 1 μM). Values are the means ± standard deviation of three independent cultures. (b,c) Peptide 3 and R9 were colocalized with lysosome marker. HeLa cells were treated with 10 μM peptides at 37 °C for 2 hr. The acidic late endosomes/lysosomes were stained with LysoTracker Red (red), and the nuclei were stained with Hoechst 33342 (blue). The scale bars represent 50 μm.