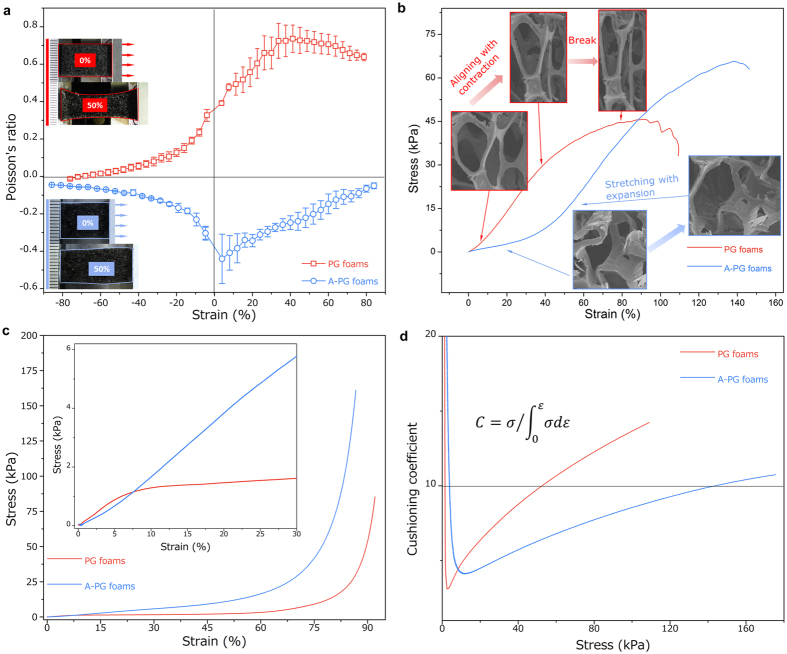
Figure 2. Mechanical characterization of PG foams and A-PG foams.
(a) Measured Poisson’s ratio versus strain for as-prepared foams (red: PG foams; blue: A-PG foams). Inset: digital picture of PG and A-PG foams under 0 and ~50% strain. (b) Measured tensile stress of PG and A-PG foams as a function of strain. Insets show the in situ SEM imaging of a representative cell. Compared to PG foams, A-PG foams behave more flexible and stretchable due to rotational deformation of the buckled structure at initial 0–30% tensile strain. (c) Measured compressive stress of PG and A-PG foams as a function of strain. When compressive strain is applied up to 30%, Inset shows linear stress–strain curve for A-PG foams whereas two distinct modulus regions are observed for PG foams. All the strain here are engineering strain. two distinct modulus regions are observed. (d) Cushioning coefficients of PG and A-PG foams across a stress range of 0–180 kPa. Horizontal dashed line indicates a coefficient of 10.

