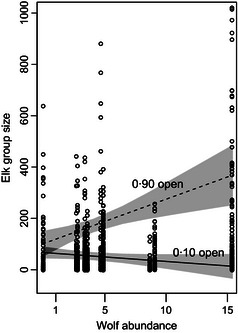
Figure 5.

Relationships between 0·90 quantile group sizes and wolf abundance in open and closed habitats. Shaded area indicates 95% confidence intervals. Along the x‐axis, group size data are clustered by hunt area. From left to right, hunt areas are 25 (far left), 99, 121, 54, 59, 63, 52, 51, 50 and 67 (far right).
