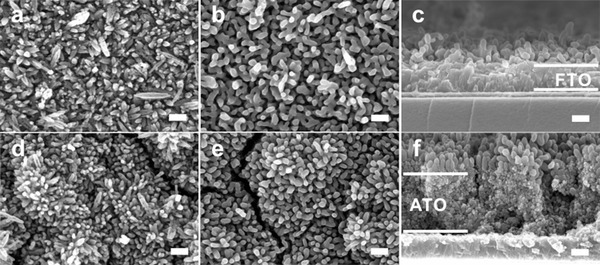
Figure 2.

Morphology of AHN and HN before and after HTA at 800 °C. a) The SEM image of HN before HTA at 550 °C. b,c) The SEM image of HN after HTA at 800 °C. d) The SEM image of AHN before HTA at 800 °C. e,f) The SEM image of AHN after HTA at 800 °C. The scale bar in all images is 200 nm.
