Figure 3.

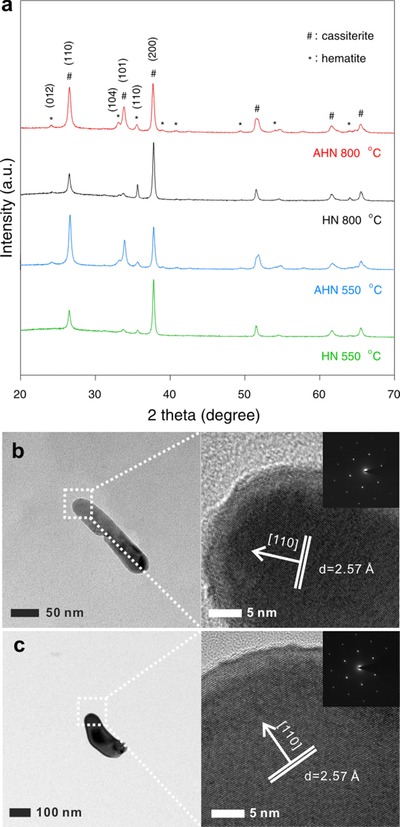
Structures of AHN and HN. a) The XRD patterns of AHN and HN before and after annealing at 800 °C. b) HRTEM images of AHN. c) HRTEM images of HN.

Structures of AHN and HN. a) The XRD patterns of AHN and HN before and after annealing at 800 °C. b) HRTEM images of AHN. c) HRTEM images of HN.