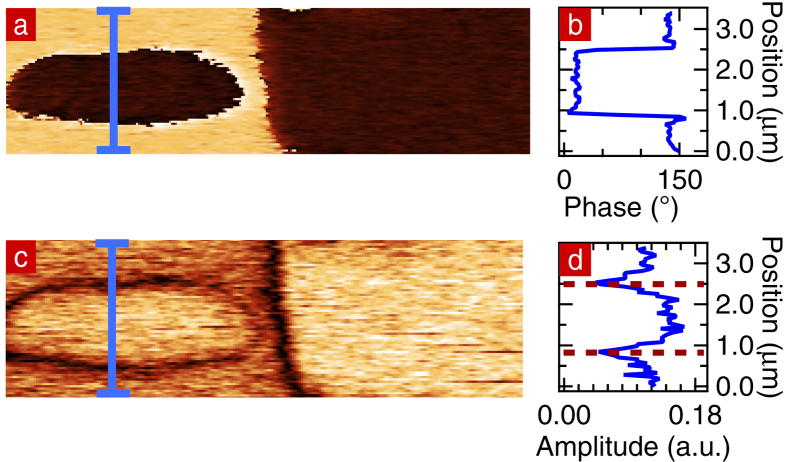
Figure 2.
(a) PFM-phase image of the sample where −200 V was applied. (b) PFM-phase profile extracted along the blue line on the PFM-phase image. (c) PFM-amplitude image of the same area. (d) PFM-amplitude profile extracted along the blue line. The position of the domain walls are indicated by dotted lines.

