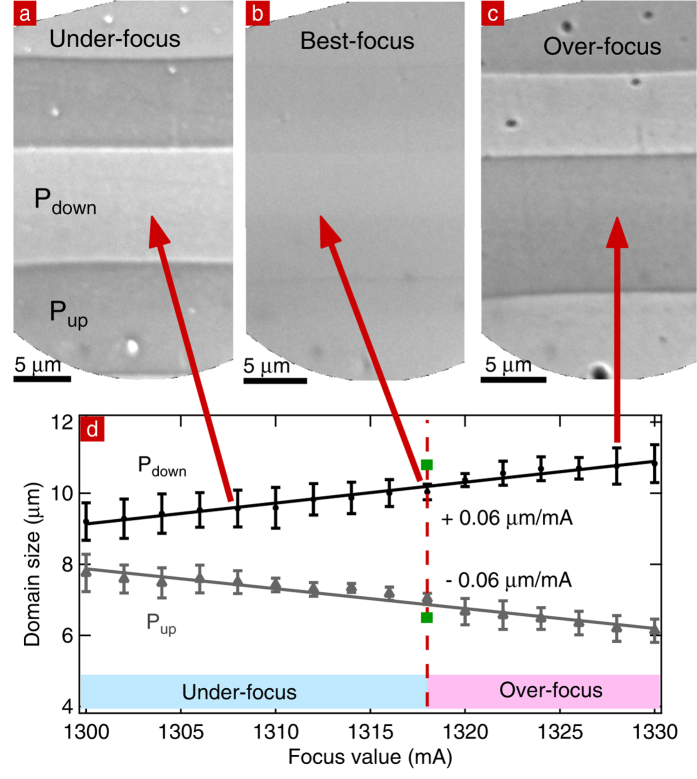
Figure 5.
(a) Under-focus (b) best-focus and (c) over-focus images of the same area taken at 450 °C. (d) Evolution of the domain sizes with focus values expressed in coil current (mA): under-focus indicated by the light blue bar, best-focus indicated by the fuchsia dashed line, and over-focus images indicated by the light pink bar. Solid lines are linear fit of slope +0.06 μm/mA and −0.06 μm/mA. Green squares indicate the domain size as measured by PFM and reside on the best-focus line.

