Figure 7.

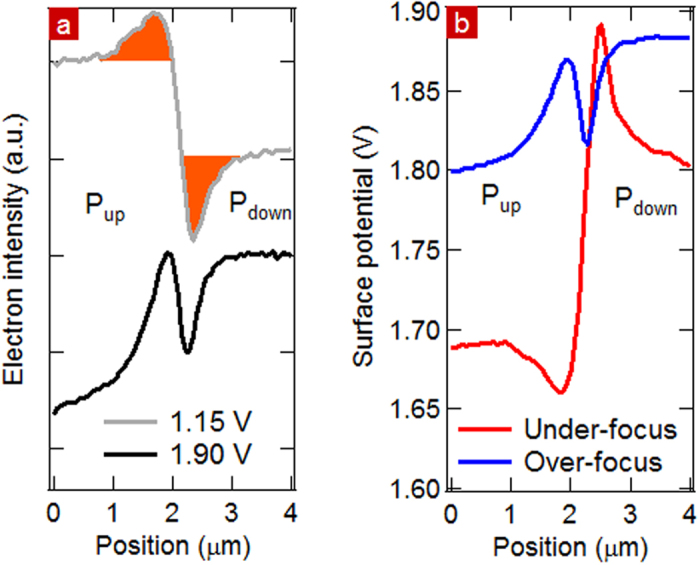
(a) Intensity profile in MEM (SV = 1.15 V) and LEEM (SV = 1.90 V). (b) Surface potential profile across a domain wall determined from the MEM-LEEM curves for over- and under-focus values.

(a) Intensity profile in MEM (SV = 1.15 V) and LEEM (SV = 1.90 V). (b) Surface potential profile across a domain wall determined from the MEM-LEEM curves for over- and under-focus values.