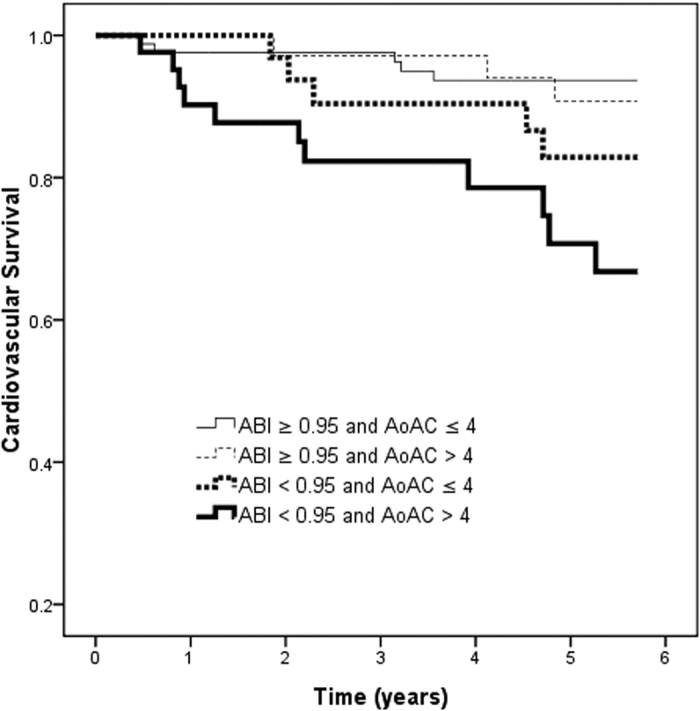
Figure 2. Kaplan-Meier analyses of cardiovascular survival (log-rank p = 0.001) among 4 study groups.

The group with ABI < 0.95 and AoAC score > 4 had a worse cardiovascular survival than that with ABI ≥ 0.95 and AoAC score ≤ 4.

The group with ABI < 0.95 and AoAC score > 4 had a worse cardiovascular survival than that with ABI ≥ 0.95 and AoAC score ≤ 4.