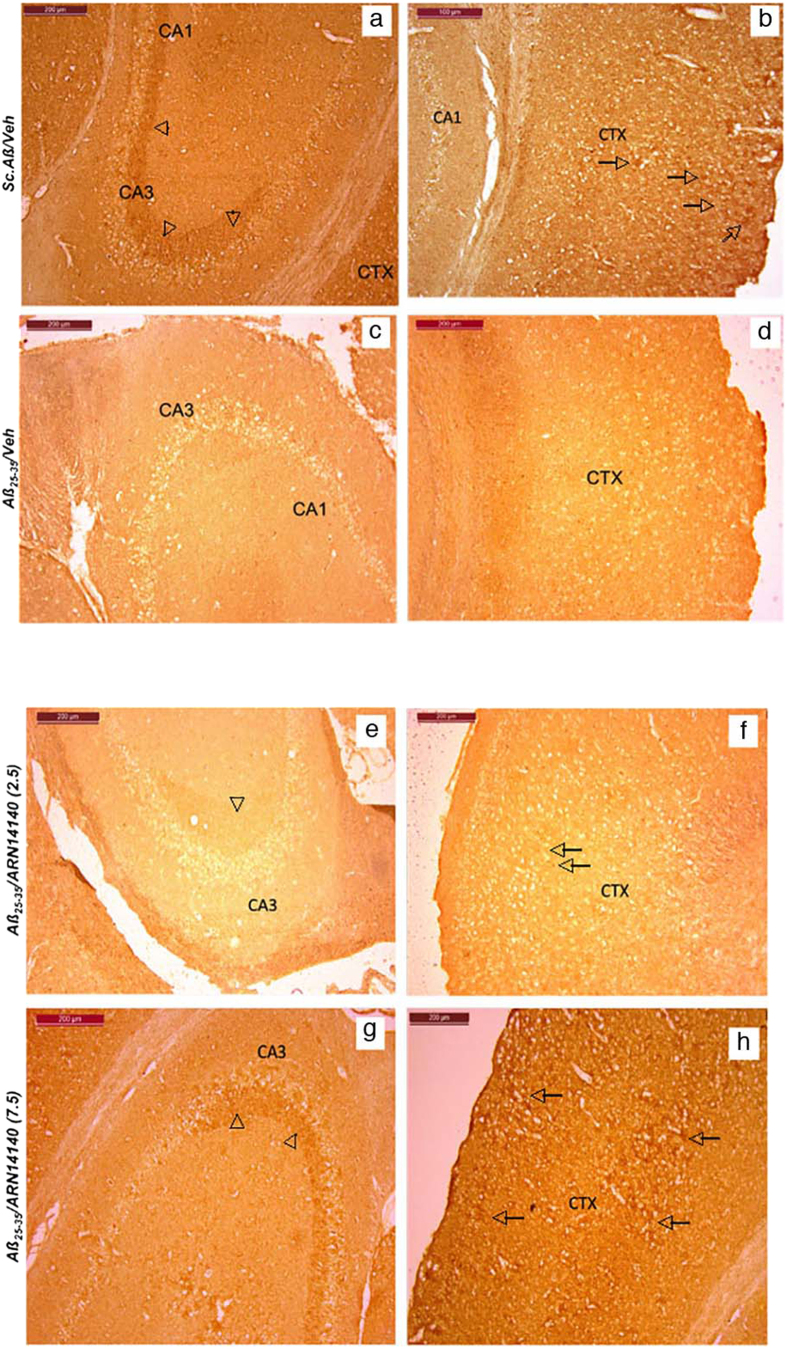
Figure 6. Immunohistochemical staining of VAChT in Aβ25-35-treated mouse.
Hippocampus (a,c) and cortex (b,d) CA3 field in: (a,b) Sc.Aβ/V-treated mouse and (c,d) Aβ25-35/V-treated mouse. Cholinergic nerve terminals were pointed out on the figures by arrowheads and cholinergic punctae labeling by arrows. Hippocampus (e,g) and cortex (f,h) CA3 field in: (e,f) Aβ25-35/ARN14140 (2.5)-treated mouse and (g,h) Aβ25-35/ARN14140 (7.5)-treated mouse. Scale bar = 200 μm.

