
Figure 6. Phylogenetic placement of G. lineatum based on COI gene.
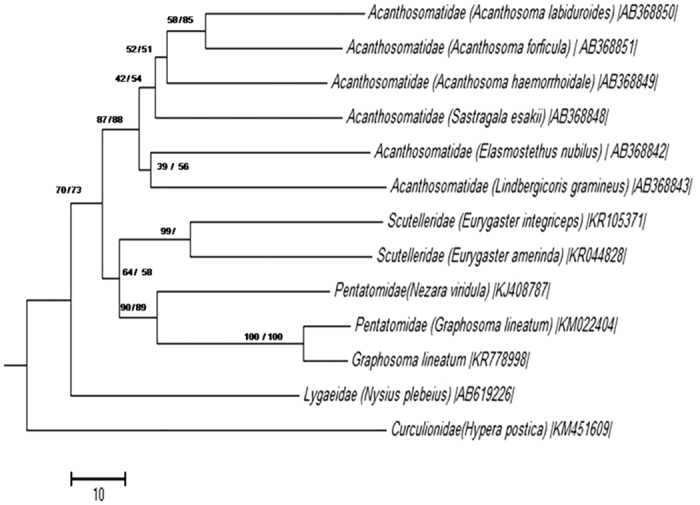
ML: maximum likelihood method with 100 replications based on GTR + G + I model. NJ: neighbor-joining method with 1000 replications. On the nodes are the bootstrap probabilities neighbor-joining/maximum likelihood analysis are shown. Accession numbers of sequences are shown in brackets.