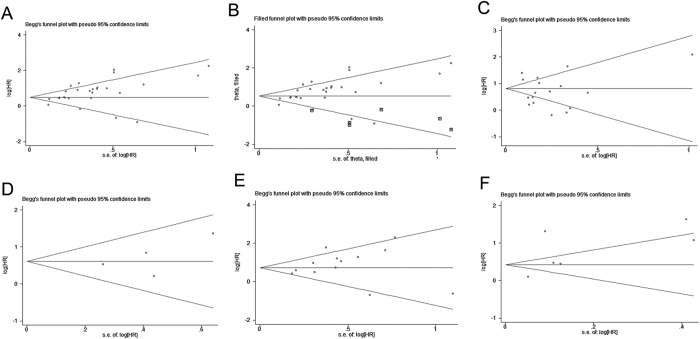
Figure 6. Assessment of publication bias for OS, DSS, and PFS/MFS/RFS studies.
Panel (A) depicts the assessment of publication bias for multivariate model studies, by funnel plot analysis, whereas panel (B) shows funnel plot analysis using nonparametric Trim and Fill method. Panel (C) represents the publication bias in univariate model studies. Panel (D) represents the assessment of publication bias for multivariate model. Panels (E,F) represents assessment of publication bias for multivariate and univariate model studies, respectively.

