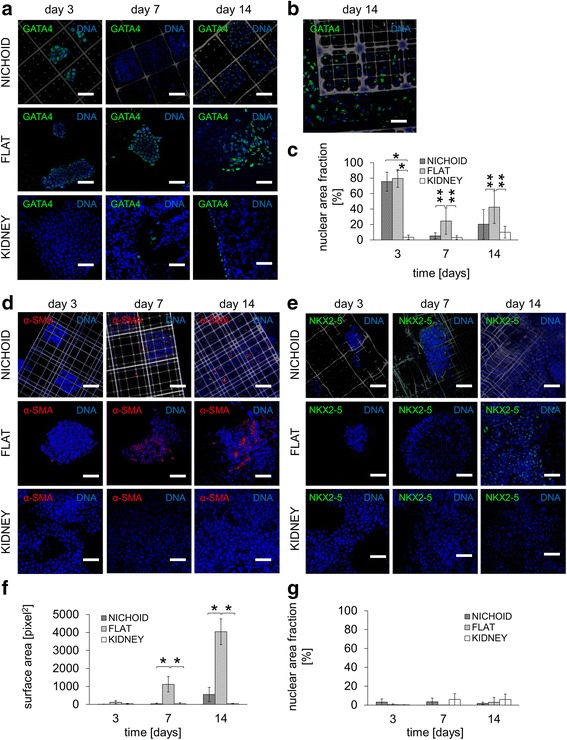
Fig. 4.

Spontaneous endodermal and mesodermal differentiation of mES cells cultured in the nichoid substrates, compared to flat glass and to kidney ECM. Cells were cultured in the absence of a feeder layer and with LIF up to day 3, then without neither a feeder layer nor LIF from day 4 to day 14. a Immunofluorescence for GATA4 (green) and DAPI (blue) in the nichoid (gray), the flat glass and the kidney ECM at day 3, 7, and 14. The scale bar is 50 μm. b Detail of a flat region surrounding a nichoid block, showing a possible paracrine effect generated by GATA4+ cells on the expression of the GATA4 marker by cells of peripheral nichoids. The scale bar is 20 μm. c Quantification of GATA4 expression by image processing; n = 15, * p < 0.01 ** p < 0.05. d Immunofluorescence for α-SMA (red) and DAPI (blue) in the nichoid (gray), the flat glass and the kidney ECM at day 3, 7, and 14. The scale bar is 50 μm. e Immunofluorescence for NKX2.5 (green) and DAPI (blue) in the nichoid (gray), the flat glass and the kidney matrix substrate at day 3, 7, and 14. The scale bar is 50 μm. f Quantification of α-SMA expression by image processing; n = 15, * p < 0.01 ** p < 0.05. g Quantification of NKX2.5 expression by image processing; n = 15, * p < .0.01 ** p < 0.05
