. 2016 Sep 9;6:32851. doi: 10.1038/srep32851

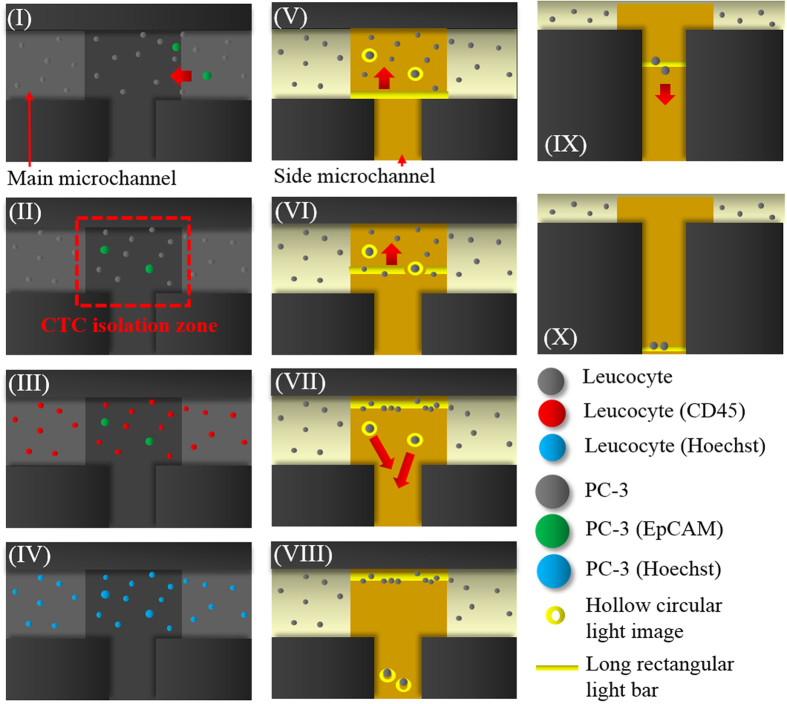
Figure 2. Schematic illustration of the overall cancer cell isolation processes (I) Fluorescent microscopic observation was performed in the CTC isolation zone to detect the cancer cell images (green dots) in a dynamic cell suspension flow; (II) the cell suspension flow was temporarily suspended when the cancer cells (green dots) were observed in the CTC isolation zone; (III) fluorescent microscopy operations were performed to observe the leukocytes (red dots), cancer cells (green dots) and (IV) all nucleated cells (blue dots); (V) the target cancer cells [i.e., EpCAM marker- and Hoechst dye-positive (green and blue dots) and CD45 marker-negative images (non-red dots)] were precisely positioned under light field microscopic imaging through the abovementioned contradistinction; (VI) ODEP force-based cell manipulation was performed to separate the cancer cells targeted from the leukocytes: hollow circular light images (ID: 40 μm; light bandwidth: 40 μm) were used to enclose the target cancer cells, and a long rectangular light bar (bar length: 1000 μm; bar width: 150 μm) was used to manipulate the leukocytes; (VII) the long rectangular light bar was moved (moving velocity: 100 μm s−1) to sweep all unenclosed leukocytes to the one side of the main microchannel leaving the enclosed cancer cells in the same positions; (VIII) the hollow circular light images were moved (moving velocity: 50 μm s−1) to manipulate the enclosed cancer cells to the side microchannel for collection; (IX)-(X) another moving rectangular light bar (bar length: 1000 μm; bar width: 150 μm; moving velocity: 100 μm s−1) was used to transport the cancer cells collected to a site near the through-hole for harvesting.

Figure 2