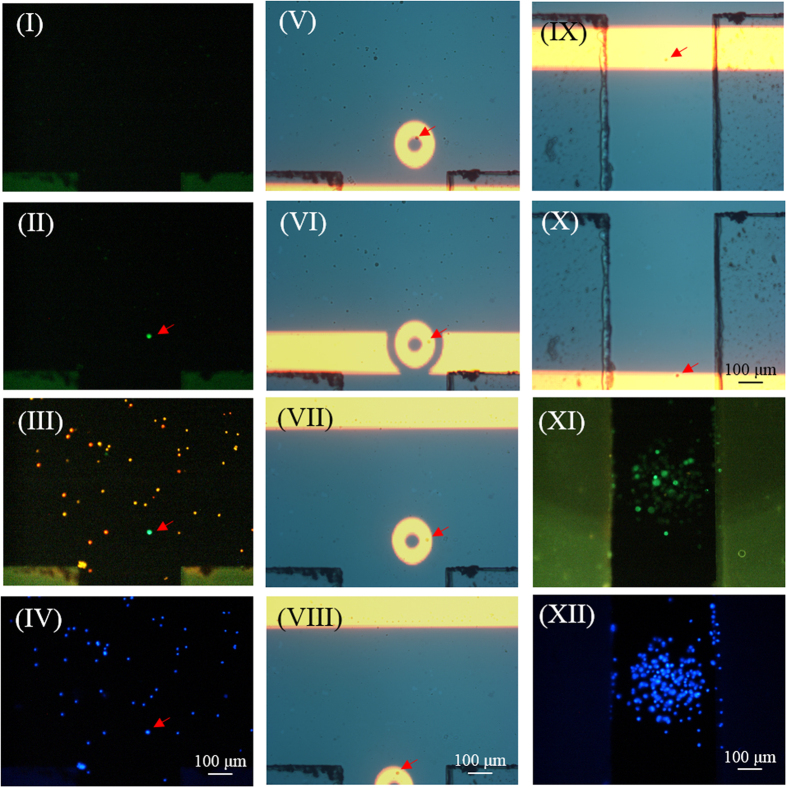
Figure 5. The overall CTC isolation and purification processes: (I) fluorescent microscopic observation was performed on the CTC isolation zone to detect the cancer cell images (green dots) in a dynamic cell suspension flow; (II) the cell suspension flow was temporarily suspended when the cancer cells (green dots) were observed in the CTC isolation zone; (III)-(IV) fluorescent microscopy operations were performed to observe the leukocytes (red dots), cancer cells (green dots), and all nucleated cells (blue dots) for cancer cell positioning purposes; (V) a hollow circular light image was used to enclose the target cancer cells, and a long rectangular light bar was used to manipulate the leukocytes; (VI)-(VII) the long rectangular light bar was moved to sweep all unenclosed leukocytes to one side of the main microchannel, leaving the enclosed cancer cells in the same positions; (VIII) the circular light image was moved to manipulate enclosed the cancer cells to the side microchannel for collection; (IX)-(X) another moving rectangular light bar was used to transport the cancer cells collected to a site near the through-hole for harvesting; (XI)-(XII) immunofluorescent microscopic observations were performed to examine the purity of cancer cells [the leukocytes (red dots), cancer cells (green dots), and all nucleated cells (blue dots)].
(Three video clips are provided as the 1st, 2nd and 3rd video clips).

