
Figure 6. Comparison of relative gene (MRP4 and MRP5) expression levels of the cancer cells isolated by the two CTC isolation schemes (namely, a negative selection-based CTC isolation method and the same method with an additional ODEP-based CTC isolation process) studied.
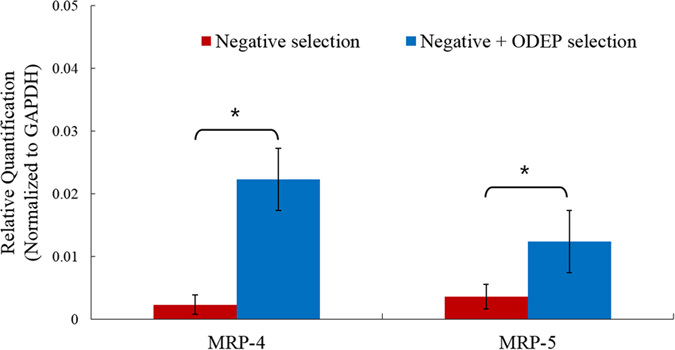
In the comparison, the relative quantification of the MRP4 and MRP5 gene expression levels of cancer cells was conducted. The gene expression levels were normalized to individual house-keeping genes (GAPDH) [results were given as the mean ± standard deviation of 3 separate experiments. Significant difference is indicated by stars (*p < 0.05, ANOVA)].