
Fig. 1.
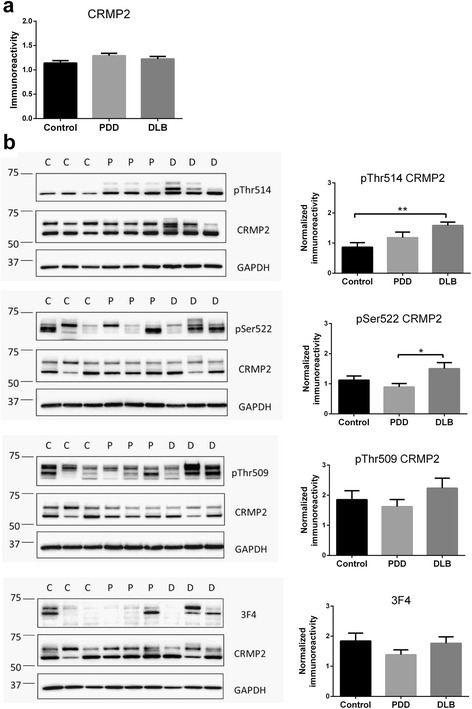
Increased CRMP2 phosphorylation at Thr514 in LBD parietal cortex. a Bar graph of total CRMP2 immunoreactivity (mean ± SEM in arbitrary units). b Representative immunoblots (with molecular weight indicators in kDa to the left of the immunoblots) and bar graphs of pCRMP2 immunoreactivities (mean ± SEM in arbitrary units) at the indicated epitopes, with GAPDH as loading control. Available N for control (C) = 19; PDD (P) = 19 and DLB (D) = 20. *p < 0.05; **p < 0.01, significant differences for multiple pair-wise comparisons (one-way ANOVA with Bonferroni post-hoc tests)