
Fig. 3.
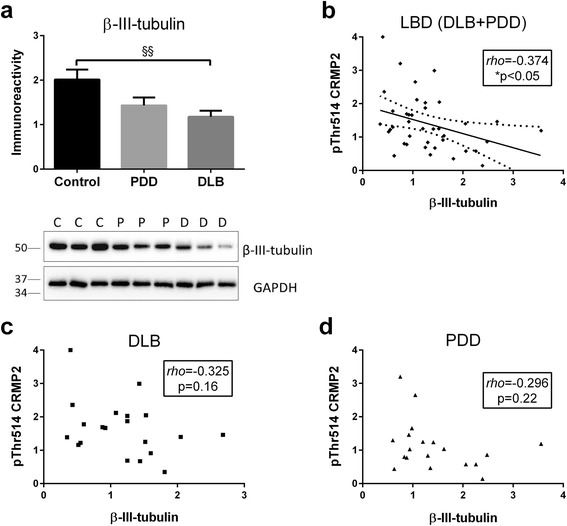
Increased pThr514 CRMP2 correlates with β-III-tubulin loss in in LBD parietal cortex. a Bar graph of β-III-tubulin immunoreactivity (mean ± SEM in arbitrary units) and representative immunoblots, with GAPDH as loading control. Scatter plots of pThr514 CRMP2 with β-III-tubulin immunoreactivities in total homogenate fractions of b LBD (DLB + PDD), c DLB and d PDD parietal cortex, with insets indicating rho and p values. Where a correlation is significant, a best-fit regression line (solid line) is added together with its 95 % prediction intervals (dotted lines). Available N for control (C) = 19; PDD (P) = 19 and DLB (D) = 20. §§ p < 0.01, significant difference for multiple pair-wise comparisons (one-way ANOVA with Bonferroni post-hoc tests). *p < 0.05, significant Spearman correlation