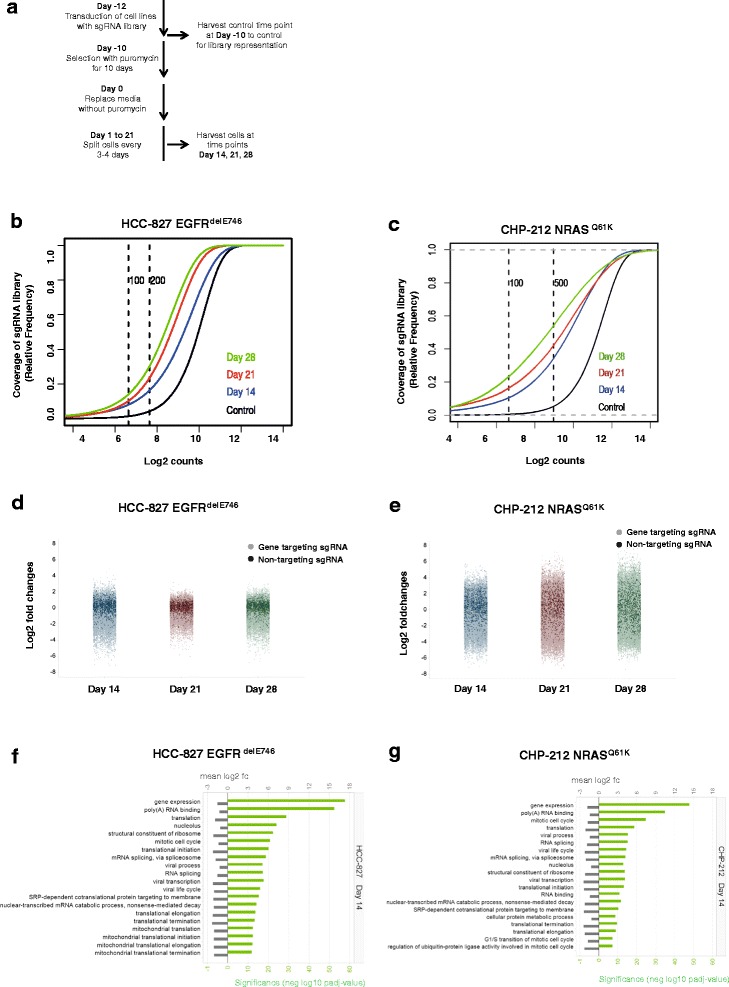
Fig. 1.

Representation of whole genome sgRNA library at different time points. a Schematic representation of the negative loss-of-function screen using lung cancer cell line HCC-827 and neuroblastoma cell line CHP-212. b Cumulative frequency of sgRNAs by deep sequencing at control time point (day −10), day 14, day 21, and day 28 for HCC-827 cell line. Shift in the curves at days 14, 21, and 28 represents the depletion of essential sgRNAs. Each time point was measured in duplicates. c Same as in b) but for CHP-212 cell line. d Plots of normalized sgRNA reads for HCC-827 cell line at time points day 14, day 21, and day 28. Dark colored dots represent the 1 000 non-targeting control sgRNAs and light colored dots represent the 57 096 targeting sgRNAs. Each time point was measured in duplicates and log2 of median fold changes versus the control time point (day −10) are represented. e Same as in d) but for CHP-212 cell line. f Gene ontology terms describing sgRNAs and genes whose knockdown causes under-representation of HCC-827 cells at day 14. g Gene ontology terms describing sgRNAs and genes whose knockdown cause under-representation of CHP-212 cells at day 14
