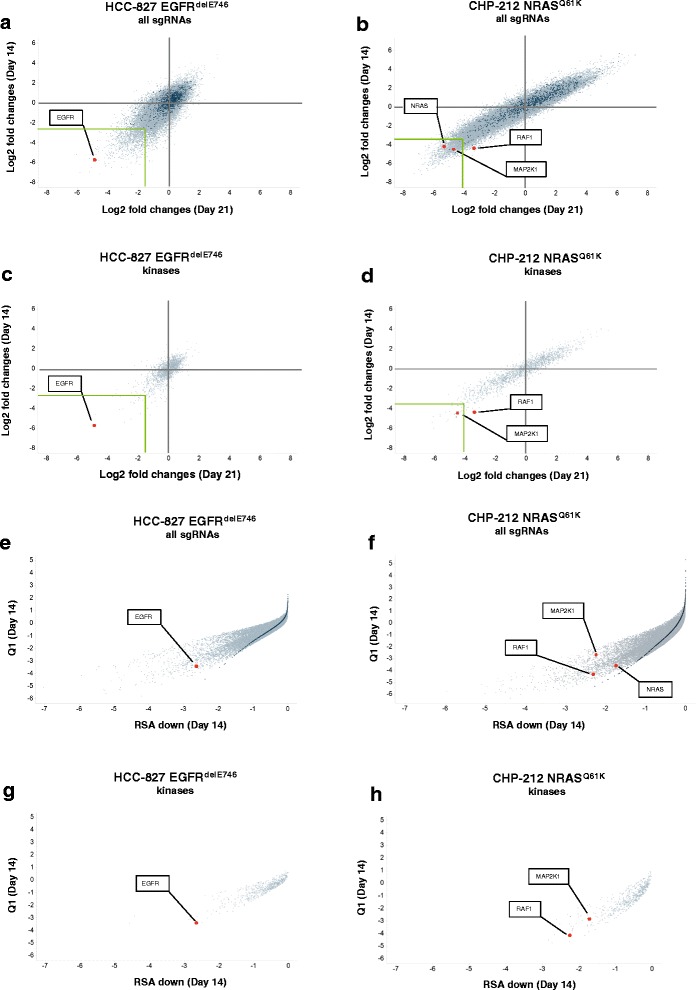
Fig. 2.

sgRNAs depleted in the whole genome screen. a Scatterplot representing fold changes of the 57 096 targeting sgRNAs in the HCC-827 cell line at day 14 and day 21. Fold changes at day 14 or day 21 were calculated compared to the control time point at day −10. All time points were measured in duplicates and median fold changes are shown. Dark green colored dots represent the 1 000 non-targeting control sgRNAs and grey colored dots represent the 57 096 targeting sgRNAs. Genes of interest were annotated by the software Spotfire and visualization was further enhanced by red colored dots. b Same as in a) but for CHP-212 cell line. c Scatterplot of fold changes of 1 571 kinases in the HCC-827 cell line at time points day 14 and day 21 versus control time point day −10. d Same as c) but for HCC-827 cells. e, f Scatterplots for Q1 and RSA down of 57 096 targeting sgRNAs in the HCC-827 (e) and CHP-212 cell lines (f) at time point day 14. Dark green colored dots represent the 1 000 non-targeting control sgRNAs. g, h Scatterplot for Q1 and RSA down of the 1 571 sgRNAs for kinases are shown for the HCC-827 (e) and CHP-212 (f) cell lines
